
What’s Known
Ulcerative colitis (UC) involves chronic intestinal inflammation, where neutrophil extracellular traps (NETs) contribute to disease progression by disrupting the mucosal barrier. Excessive NET formation correlates with increased inflammation and disease severity. Despite their critical role, the detailed mechanisms driving NET formation and reliable tissue biomarkers in UC remain unclear.
What’s New
This study identifies AQP9 as a highly upregulated gene in UC, validated in both new and treatment-resistant patients. AQP9 shows strong diagnostic accuracy, distinguishing UC patients from healthy controls, and, along with FPR1 and FPR2, may serve as key biomarkers and therapeutic targets in UC management.
Introduction
Ulcerative colitis (UC) is a chronic inflammatory bowel disease (IBD) characterized by recurring inflammation of the colon with periods of flare-ups and remission. It commonly affects individuals aged 30 to 40, with a rising global incidence and prevalence, including about 0.3% of the European population diagnosed with UC. 1 , 2 Symptoms observed include diarrhea, presence of blood in stool, decreased appetite, abdominal discomfort, nausea, vomiting, and weight loss. 3 Disease severity varies from localized rectal inflammation to extensive colitis, and diagnosis involves clinical evaluation, laboratory tests, imaging, and colonoscopy. Treatment progresses through stages, including 5-aminosalicylic acid, glucocorticoids, azathioprine, and anti-Tumor Necrosis Factor (TNF) therapy. Refractory patients are defined by failure to respond to all therapeutic stages. 4
The exact cause of inflammation in UC is unknown. Since the immune system mistakenly attacks the intestinal lining, causing inflammation, UC is considered an autoimmune disease. This inappropriate immune response may be triggered by intestinal bacteria or other environmental factors, such as diet, stress, and infections. Dysbiosis, or an imbalance in gut microbiota, might also contribute to colonic inflammation. 5 , 6 The pathogenesis of UC is complex and involves genetic, environmental, immune dysregulation, and microbiome alterations, leading to the recruitment of various inflammatory cells, including neutrophils, dendritic cells, T cells, and B cells, to the intestine. 3
Neutrophils play a critical role in UC by contributing to tissue damage through the release of reactive oxygen species, proteases, and pro-inflammatory cytokines. 7 - 9 An important neutrophil defense mechanism is NETosis, where neutrophils release neutrophil extracellular traps (NETs), web-like structures composed of DNA and antimicrobial proteins that trap pathogens. 10 While NETs help contain infections, excessive or dysregulated NET formation promotes inflammation and tissue injury. 11 - 13 Increased NET components have been found in inflamed mucosa, stool, and blood of UC patients, correlating with disease activity. 11 Previous studies have conducted transcriptomic and bioinformatic profiling of NET-associated genes in UC, identifying candidates such as CXCR1 and CXCR2 as potential diagnostic or prognostic biomarkers. These studies used methods including Mendelian randomization, machine learning, and co-expression network analyses to implicate NET-related genes in UC pathogenesis and response prediction. 14 - 16 However, the molecular mechanisms driving NET formation in UC remain poorly understood.
In this study, we performed bioinformatic analysis of gene expression data from colonic biopsies of UC patients and healthy controls and identified DEGs involved in NET formation, including Fc Gamma Receptor IIIb (FCGR3B), Aquaporin-9 (AQP9), Formyl Peptide Receptor 1 (FPR1), Formyl Peptide Receptor 2 (FPR2), and Neutrophil cytosol factor 2 (NCF2). These five genes were specifically selected from the largest gene module identified through PPI network analysis of 429 upregulated DEGs from the GSE224758 dataset. Pathway enrichment analysis using DAVID and ShinyGO revealed significant enrichment of the NET formation pathway within this module, with these five genes representing the complete set annotated to NET formation by KEGG pathway analysis. FCGR3B is a receptor expressed on neutrophils that induces NET formation through cross-linking with specific monoclonal antibodies. AQP9 regulates neutrophil migration and hyperactivation, promoting NET formation, with its distinct expression pattern highlighting biomarker potential. FPR1 and FPR2, G protein-coupled receptors, activate neutrophils and NETosis by recognizing formylated peptides from bacteria and damage signals, with roles demonstrated in multiple inflammatory diseases. NCF2, an NADPH oxidase subunit, generates ROS essential for NETosis and has been associated with NET formation in inflammatory conditions. 17 - 25
By validating the expression of these key genes in new and treatment-resistant UC patients, we aim to elucidate their role in UC pathogenesis and assess their potential as tissue biomarkers for improved diagnosis and therapeutic targeting. Our findings may provide novel insights into the contribution of NETs in UC and suggest new avenues for managing difficult-to-treat cases.
Materials and Methods
RNA Sequencing (RNA-seq) Data Resources and Identification of DEGs
This study employed a two-pronged approach, combining a bioinformatic analysis of publicly available RNA-seq data with subsequent experimental validation using patient-derived samples in a cross-sectional study design. RNA-seq data from the GSE224758 dataset, gene expression profiling of colon biopsies from UC patients and healthy volunteers, was obtained from the Gene Expression Omnibus (GEO) database (https://www.ncbi.nlm.nih.gov/geo/) to identify DEGs. The GEO2R online tool (http://www.ncbi.nlm.nih.gov/geo/geo2r/) (NCBI, USA) was used to identify DEGs between UC and healthy control groups. This analysis employed the limma package for differential expression analysis, incorporating normalization methods such as quantile normalization to ensure comparability across samples by adjusting for technical variations. When addressing multiple testing correction, the Bonferroni correction was applied to control for false positives (supplementary file S1). DEGs were filtered using adjusted P value <0.01 and Log2 fold change threshold=1, yielding 492 DEGs (429 upregulated, 63 downregulated) in supplementary file S2.
Protein-Protein Interaction Network and Clustering
For the DEGs that are upregulated in the UC group, a co-expression Protein-Protein Interaction (PPI) network was constructed using the STRING database (version 12.0; https://string-db.org, Switzerland) with a medium confidence score (0.4) (supplementary file S3). The network was exported and visualized using Cytoscape software (version 3.10.1; Cytoscape Consortium, USA) (supplementary file S4). Clustering and module identification were performed using the Clusterviz plugin with the Fast Agglomerate Algorithm based on Edge Clustering Coefficients (FAG-EC algorithm) and a complex size threshold ≥3, identifying 14 modules. The largest module contained 31 nodes and 83 edges.
Gene Ontology and Pathway Enrichment Analyses
Gene Ontology and KEGG pathway enrichment analysis were conducted for the genes in the largest module using the DAVID database (https://davidbioinformatics.nih.gov) (NCBI/NIAID, USA). Results for KEGG pathways were downloaded and visualized using ShinyGO 0.81 (version 0.81; South Dakota State University, USA). The NET formation pathway was significantly enriched with FCGR3B, AQP9, FPR1, FPR2, and NCF2 genes.
Patient Characteristics and Sample Collection
The study population and sample collection methodology here were based on our previous study. 26 In brief, colon biopsy samples were collected between November 8, 2022, and February 2, 2025, at Tohid Hospital (Kurdistan University of Medical Sciences, Sanandaj, Iran). Written informed consent was secured from every participant involved in the study. Three groups were included: healthy controls (n=20), newly diagnosed UC patients (n=20), and treatment-resistant UC patients (n=20). Healthy controls had suspected UC ruled out by colonoscopy and pathology. UC diagnosis followed clinical, laboratory, endoscopic (Mayo score ≥6), and pathological criteria by gastroenterology specialists. Treatment-resistant UC was defined as failure to respond to 5-aminosalicylic acid (5-ASA), glucocorticoids, azathioprine, and anti-TNF therapy. Exclusion criteria included diabetes, rheumatoid arthritis, irritable bowel syndrome (IBS), and immunodeficiency. Colon biopsy samples were immediately placed in RNAlater (Sigma-Aldrich, USA) and stored at -70 °C. The study protocol was thoroughly reviewed and approved by the Ethics Committee at Kurdistan University of Medical Sciences, under approval number IR.MUK.REC.1403.285.
RNA Extraction and Synthesis of cDNA
RNA extraction was performed using the FavorPrepTM Total RNA Mini Kit (Cat. No. FABRK 000-Mini, Favorgen Biotech, Taiwan) following the manufacturer’s instructions. RNA quality was assessed (A260/280 1.8-2.0), and the purified RNA was stored at -70 °C until further analysis. Complementary DNA (cDNA) was synthesized from 1 μg RNA using the YT4500 cDNA Synthesis Kit (Yekta Tajhiz Azma, Iran) according to the standard protocol. The synthesized cDNA was diluted 1:5 and stored at -20 °C.
Reverse Transcription-Quantitative Polymerase Chain Reaction (RT-qPCR)
For the RT-qPCR assay, primers were designed using Gene Runner software (Hastings Software, USA), as listed in table 1. Each 20 µL reaction mixture contained 10 µL of YTA SYBR Green qPCR Mastermix 2X (Cat. No. YT2551; Yekta Tajhiz Azma, Iran), 1 µL each of forward and reverse primers (10 µM), 2 µL of cDNA template, and 6 µL of nuclease-free water. The thermal cycling conditions were carried out according to the manufacturer’s protocol after preparing the reaction mixture.
| Primer | Accession codes | Forward Sequence (5’ to 3’) | Reverse Sequence (5’ to 3’) | Amplicon Size (bp*) |
|---|---|---|---|---|
| β-ACTB | NM_001101 | AGATCATTGCTCCTCCTGAG | AGTCATAGTCCGCCTAGAAG | 159 |
| FCGR3B | NM_001244753 | TCCTGGAGCCTCAATGGTAC | TGGCAGCGTCAATGAAGTAG | 153 |
| NM_000570 | ||||
| NM_001271035 | ||||
| NM_001271036 | ||||
| NM_001271037 | ||||
| AQP9 | NM_020980 | AAGCTATTCTCAGTCGAGGAC | TCATCCGTCCAAAGAGACAC | 156 |
| NM_001320635 | ||||
| NM_001320636 | ||||
| FPR1 | NM_001193306 | TGCCAGTTATCATTCGTGTG | AATGATGAACCGGATGATGC | 152 |
| NM_002029 | ||||
| FPR2 | NM_001462 | TCTTTCACGGCCACATTACC | TTGATGTCCACCACGATGTG | 107 |
| NM_001005738 | ||||
| NCF2 | NM_000433 | TCATGTTCAACGGGCAGAAG | CTTTGGAACTAGGAGGAGCTG | 135 |
| NM_001127651 | ||||
| NM_001190794 | ||||
| NM_001190789 | ||||
| NM_001410895 | ||||
| *bp: Base pair | ||||
To confirm primer specificity and optimize reaction conditions, a temperature gradient PCR was conducted for each primer pair targeting FCGR3B, AQP9, FPR1, FPR2, NCF2, and the reference gene β-ACTB. PCR products were analyzed on 2% agarose gels to verify the presence of single amplicons of expected sizes (table 1 and supplementary figure 1S). Standard curves generated from 5-point, 10-fold serial cDNA dilutions confirmed amplification efficiencies (E) of 90-110% for all primers. Melt curve analysis (65-95 °C) verified product specificity (supplementary figures 2S-7S). All reactions were performed in technical duplicates. Relative gene expression data were analyzed using the 2-ΔCT [2-(CT target gene–CT reference gene)] method. 27
Statistical Analysis
The normality of the data distribution was evaluated using the Shapiro–Wilk test. For comparisons among more than two groups, the Kruskal–Wallis test was applied, followed by Dunn’s post hoc test with multiple-comparison correction. ROC curves were generated in GraphPad Prism (version 7.0; GraphPad Software, USA), and the optimal cutoff was determined using the Youden index. Data visualization was conducted with GraphPad Prism. Statistical significance was considered at P values less than 0.05, with non-significant results indicated as “ns”.
Results
Number of Participants
A total of 83 individuals were assessed for eligibility for the experimental validation phase of the study. Of these, 23 were excluded for not meeting the inclusion criteria, as 15 patients had a concurrent diagnosis of IBS, and eight patients had insufficient biopsy material. The final analysis included a total of 60 participants, comprising 20 healthy controls, 20 newly diagnosed UC patients, and 20 treatment-resistant UC patients.
Identification of DEGs in UC
The expression and distribution of all DEGs with an adjusted P value of less than 0.01 and Log2 fold change threshold =1 are illustrated in a volcano plot (figure 1). We identified 492 DEGs, which included 429 upregulated and 63 downregulated genes.
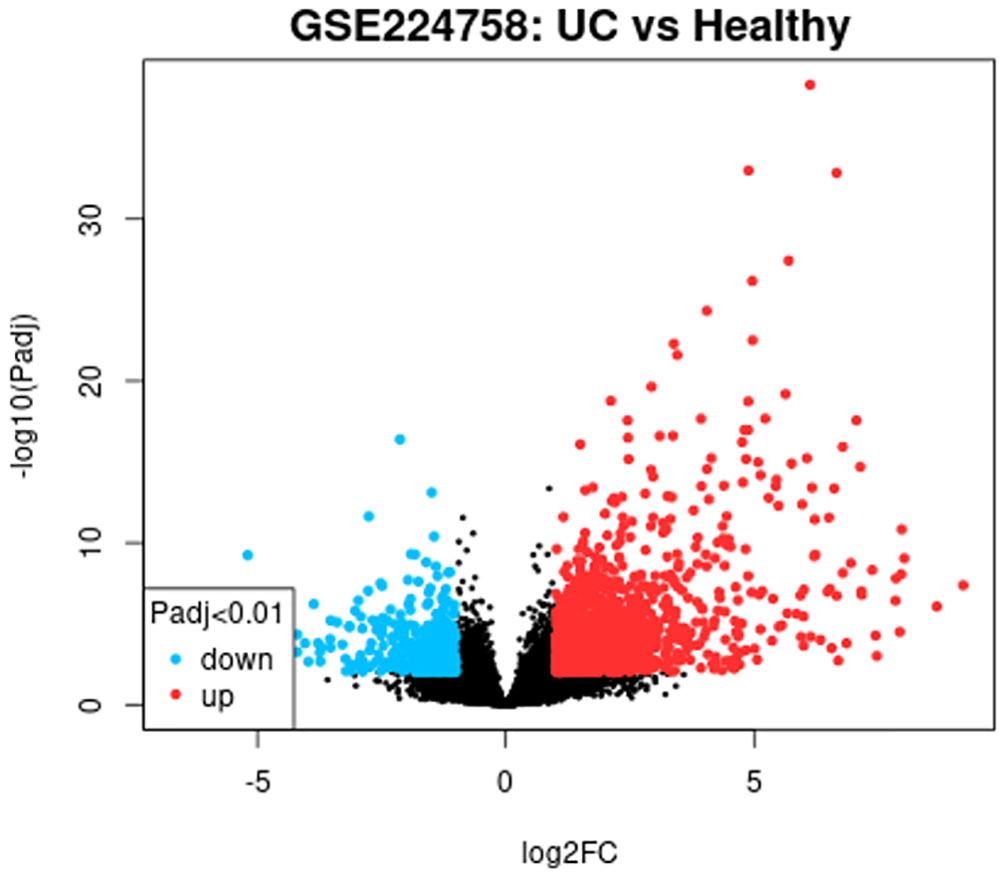
Figure 1. Volcano plot analysis of the GSE224758 dataset reveals 492 DEGs between UC patients and healthy controls. Red dots represent 429 significantly upregulated genes (adj. P<0.01, Log2FC ≥1), while blue dots indicate 63 downregulated genes (adj. P<0.01, Log2FC ≤-1). Black dots show non-significant genes. DEGs: Differentially expressed genes; UC: Ulcerative colitis.
PPI Network and Clustering
A co-expression PPI network for DEGs upregulated in UC compared to healthy controls was constructed using the STRING database. Clustering was performed using Cytoscape software with the Clusterviz plugin, revealing 14 modules (clusters). The largest module included 31 nodes and 83 edges, as shown in figure 2.
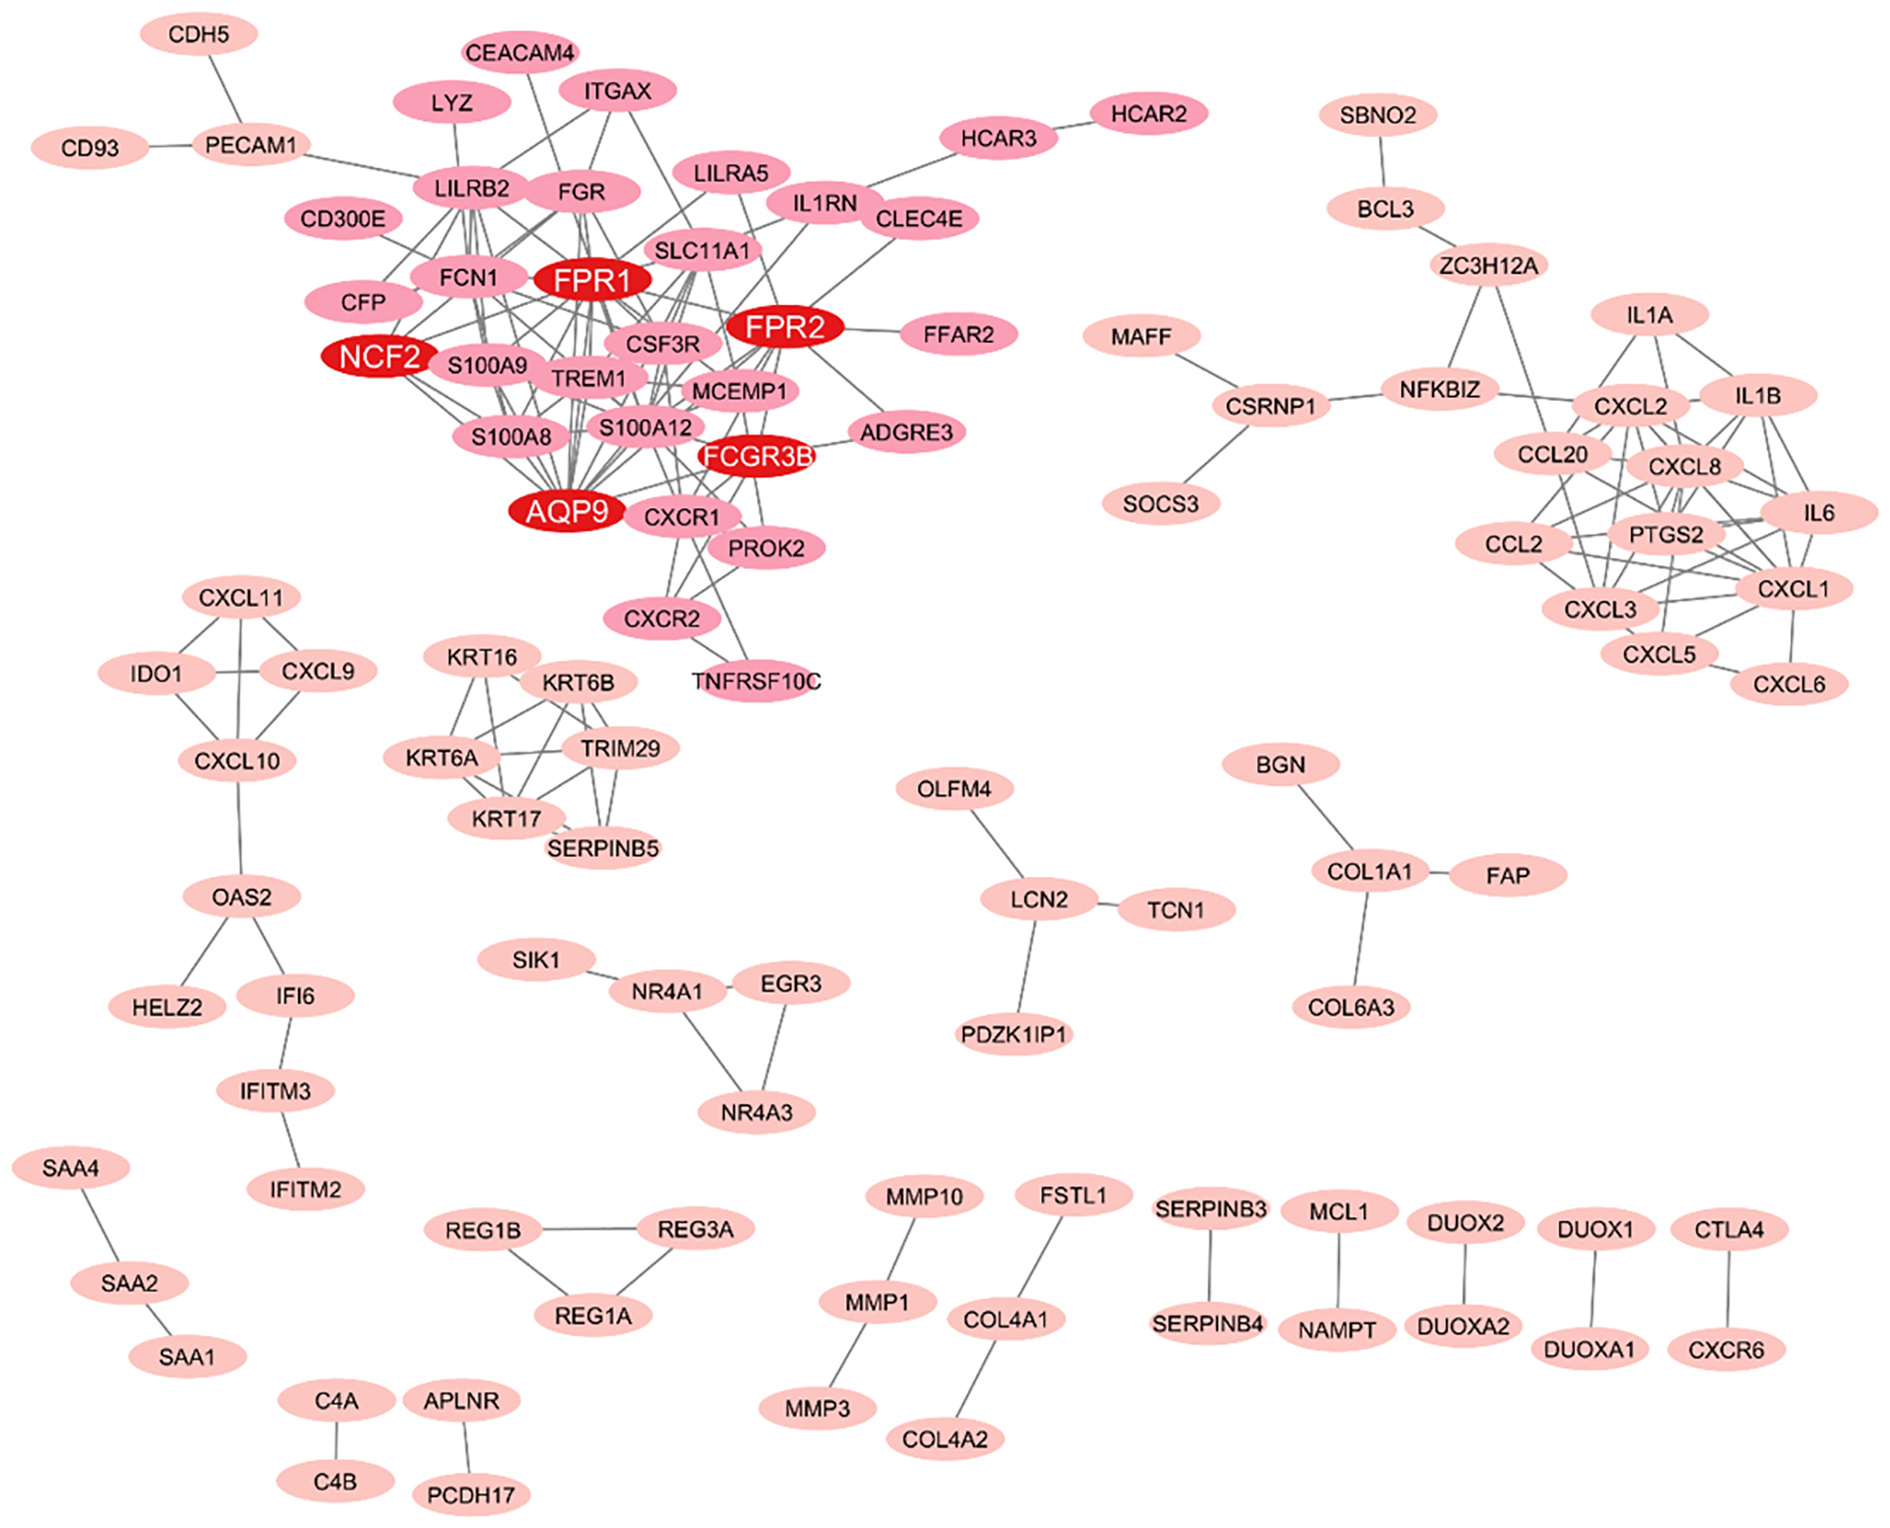
Figure 2. Co-expression PPI network analysis of UC-upregulated DEGs (STRING v. 12.0, confidence ≥0.4) uncovers the largest cluster (31 nodes/83 edges) via Cytoscape 3.10.1 Clusterviz. Node size represents degree (max=14), and edge thickness reflects STRING score (0.4–0.999, average hub confidence 0.59–0.63). In the largest module, red nodes highlight the five key hub genes (FPR1, AQP9, FPR2, FCGR3B, NCF2), whereas light pink nodes indicate their interacting partners within the module. FPR1 (degree=14, Betweenness=0.147, Closeness=0.559, Stress=484), AQP9 (12, 0.218, 0.550, 644), FPR2 (10, 0.179, 0.485, 488), FCGR3B/NCF2 (degree=6). PPI: Protein-Protein Interaction; DEGs: Differentially expressed genes; UC: Ulcerative colitis; FPR1: Formyl Peptide Receptor 1; AQP9: Aquaporin-9; FPR2: Formyl Peptide Receptor 2; FCGR3B: Gamma Receptor IIIb; NCF2: Neutrophil cytosol factor 2
Pathway Enrichment Analyses of Upregulated Genes
Pathway enrichment analyses for the largest gene module indicate that UC is associated with abnormal immune function. More specifically, genes involved in the NET formation pathway were significantly upregulated (figure 3). The study also identified five genes involved in the NET formation pathway: FCGR3B, AQP9, FPR1, FPR2, and NCF2.
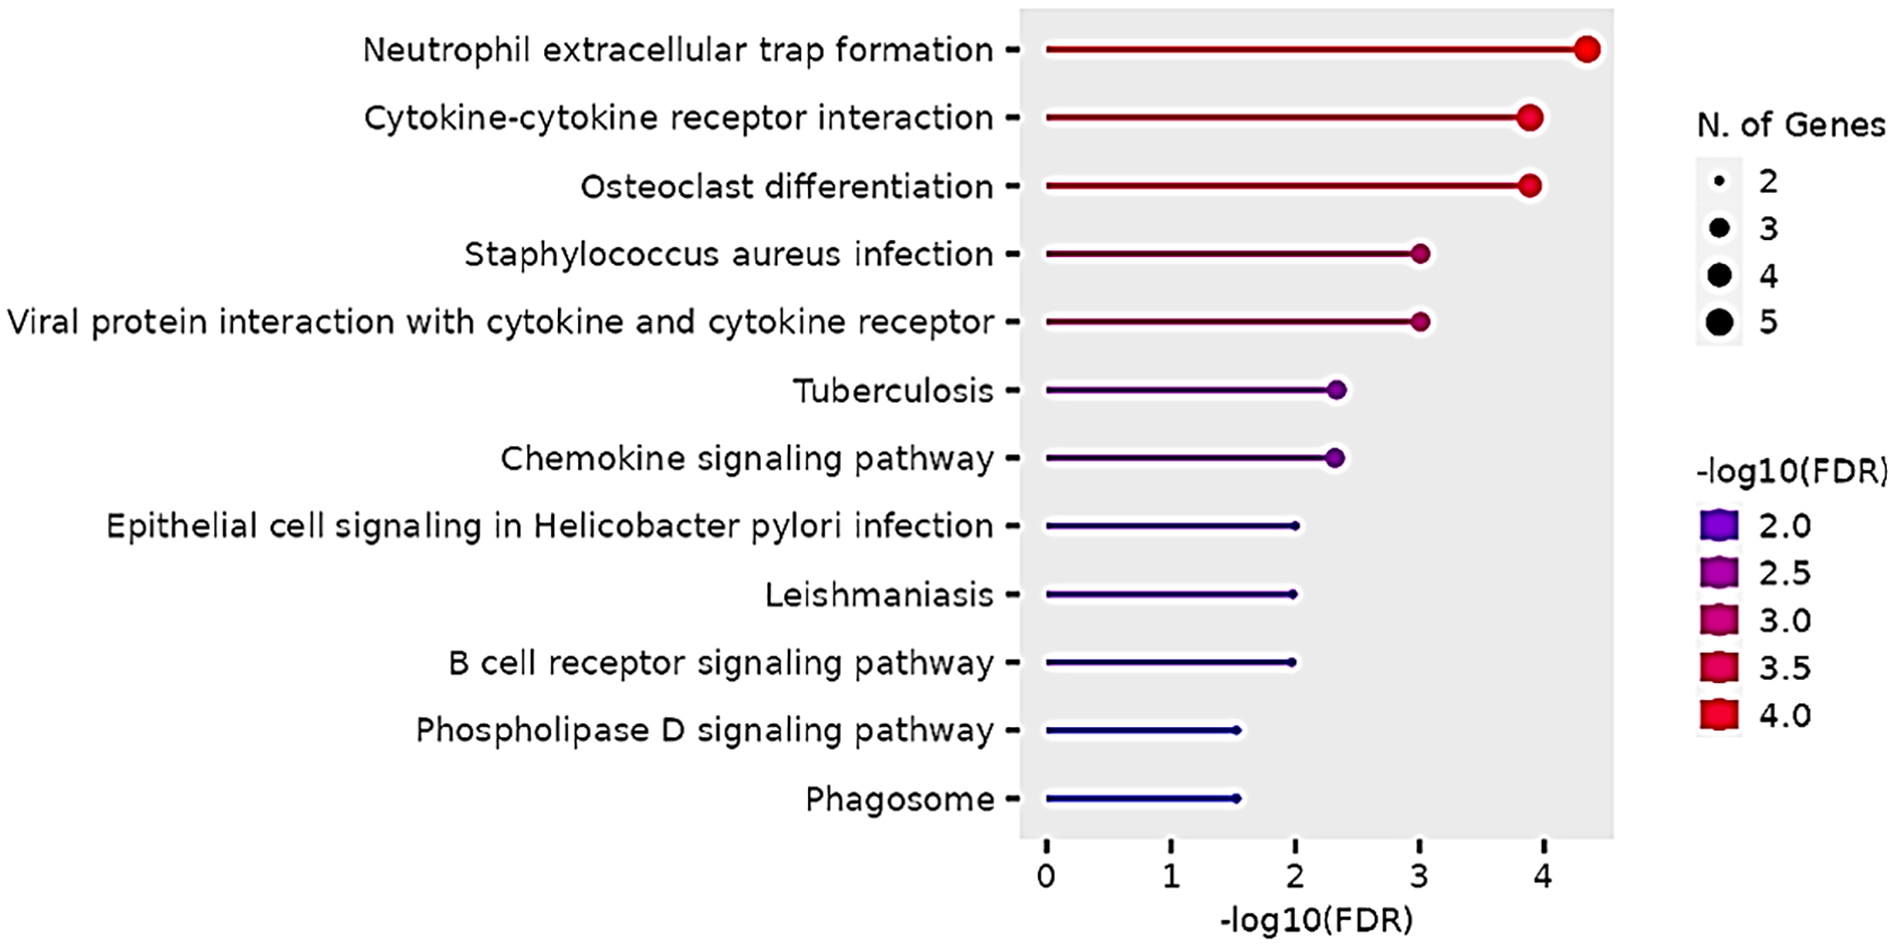
Figure 3. Pathway enrichment analysis of the largest gene module reveals significant enrichment of genes involved in the NETs formation pathway. Key genes highlighted include FCGR3B, AQP9, FPR1, FPR2, and NCF2. FCGR3B: Gamma Receptor IIIb; AQP9: Aquaporin-9; FPR1: Formyl Peptide Receptor 1; FPR2: Formyl Peptide Receptor 2; NCF2: Neutrophil cytosol factor 2
RT-qPCR Results for the Five Top Genes in the NET Pathway
RT-qPCR validation confirmed the differential expression of NET-associated genes among the study groups. AQP9 expression was markedly elevated in both new UC cases and treatment-resistant patients. Compared with healthy controls, AQP9 increased approximately 9.7-fold in new cases and 19.3-fold in resistant patients (Control median: 4.17×10⁻⁵, New Case: 3.86×10⁻⁴, Resistance: 7.88×10⁻⁴). These increases were statistically significant (P<0.0001 for both comparisons). FPR1 and FPR2 also showed significant upregulation, with ~4–5-fold higher expression in UC groups relative to controls (P=0.03 and P=0.02). In contrast, NCF2 and FCGR3B did not demonstrate statistically significant changes across groups (figure 4). Receiver operating characteristic (ROC) curve analysis was performed to evaluate the ability of AQP9 expression to discriminate UC patients from healthy controls. As shown in figure 5, comparison between healthy controls and newly diagnosed UC patients demonstrated excellent discriminatory performance, with an area under the curve (AUC) of 0.9382 (SE=0.04109; 95% confidence interval [CI]: 0.8577–1.000; P<0.0001). At the optimal cutoff determined using the Youden index, sensitivity was 83.49%, and specificity was 67.77%. Consistently, ROC analysis comparing healthy controls and treatment-resistant UC patients showed strong discrimination, with an AUC of 0.8789 (SE=0.06258; 95% CI: 0.7563–1.000; P<0.0001). At the optimal cutoff, sensitivity was 80.98%, and specificity was 64.24%. Together, these findings indicate that AQP9 expression exhibits high discriminatory accuracy for distinguishing UC patients from healthy individuals.
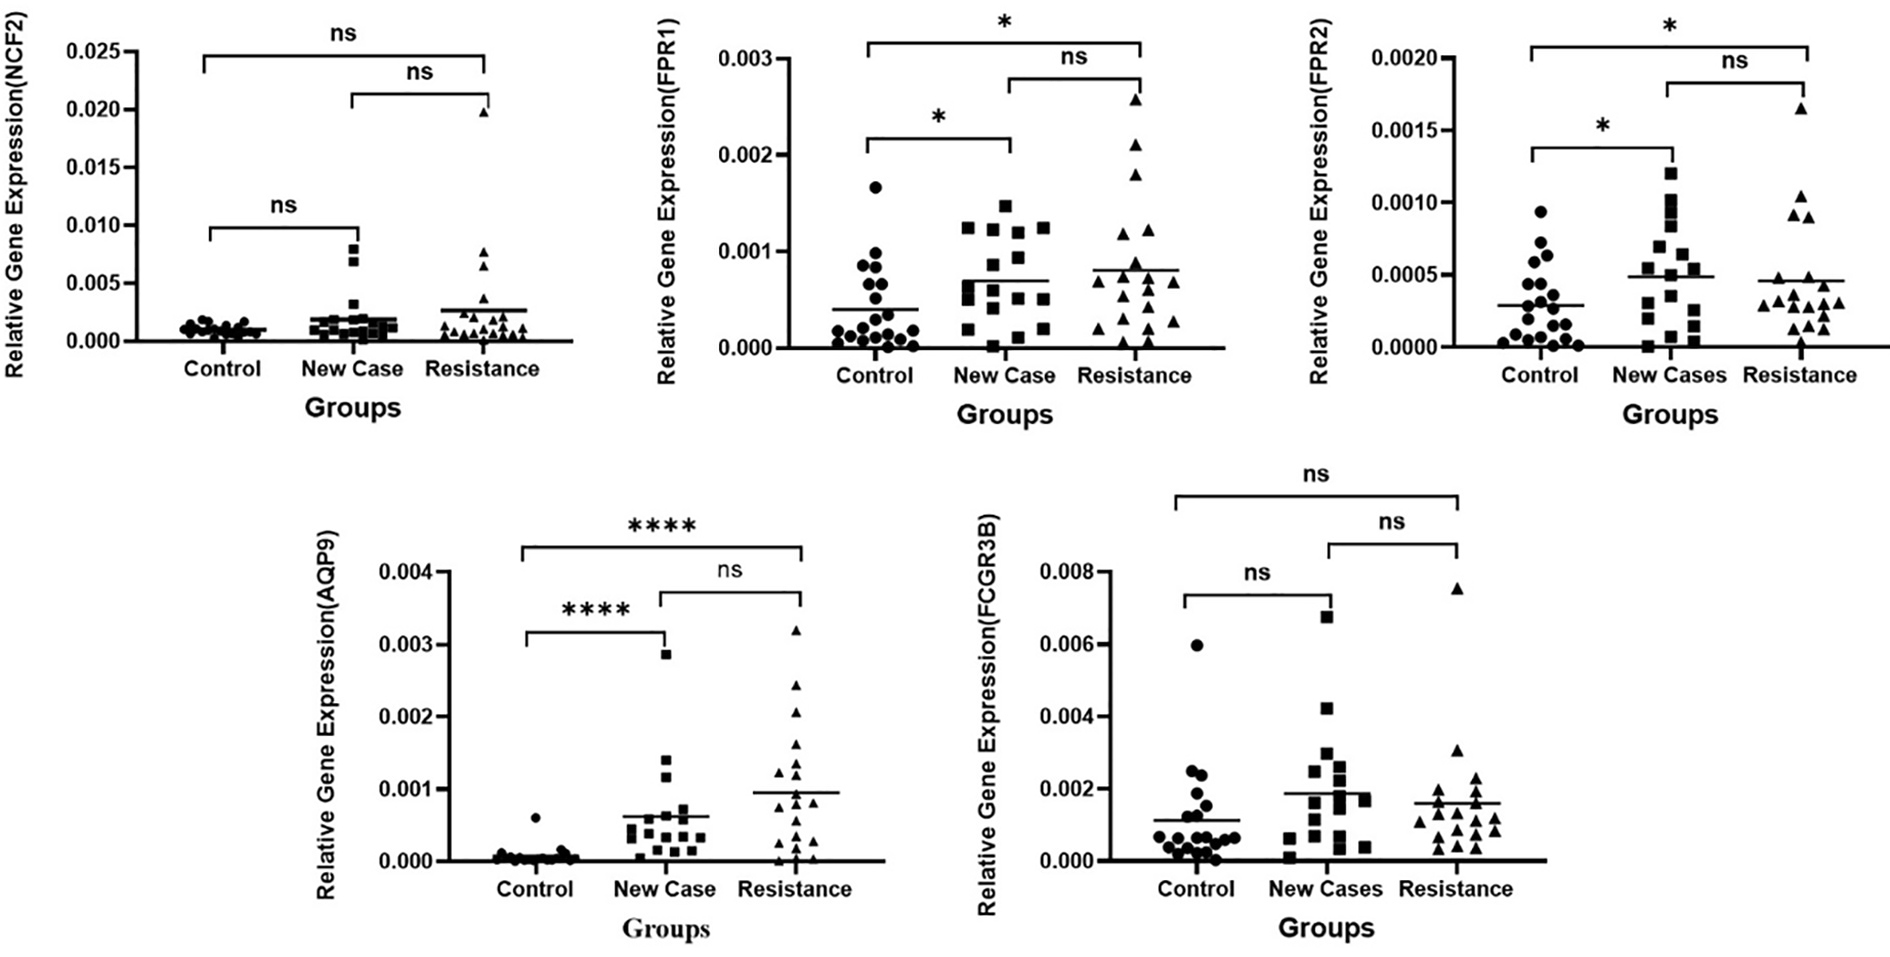
Figure 4. Results of RT-qPCR analysis are shown, which was performed to quantify expression of five NET-related genes (NCF2, FPR1, FPR2, AQP9, and FCGR3B) in healthy controls (n=20), new UC cases (n=20), and treatment-resistant UC patients (n=20). Statistical analysis was performed using the Kruskal–Wallis test for overall group differences, followed by Dunn’s post hoc test for pairwise comparisons. NCF2: No significant differences were observed among the three groups (Kruskal–Wallis P=0.47; all pairwise comparisons ns). FPR1: Expression was significantly increased in new UC cases compared with controls, while control vs. resistant and new case vs. resistant comparisons were non-significant. FPR2: Both new UC cases and resistant patients showed significantly higher expression relative to controls (P=0.03 and P=0.02, respectively), whereas new case vs. resistant comparisons were non-significant. AQP9: Expression was markedly elevated in both UC groups relative to controls (Kruskal–Wallis P<0.0001). Pairwise Mann–Whitney tests showed strong significance for control vs. new case (P<0.0001) and control vs. resistant (P<0.0001), while new case vs. resistant remained non-significant. Median values correspond to approximately 9–10-fold (new case) and 19–20-fold (resistant) increases compared with controls. FCGR3B: Expression trended higher in UC groups but did not reach statistical significance (Kruskal–Wallis P=0.08); all pairwise comparisons ns. Data are presented as individual values with horizontal bars indicating median±interquartile range. Significance levels are indicated in the figure as: ns: not significant; *P<0.05, ****P<0.0001. RT-qPCR: Reverse transcription-quantitative polymerase chain reaction; NET: Neutrophil Extracellular Traps; UC: Ulcerative colitis; NCF2: Neutrophil cytosol factor 2; FPR1: Formyl Peptide Receptor 1; FPR2: Formyl Peptide Receptor 2; AQP9: Aquaporin-9; FCGR3B: Gamma Receptor IIIb
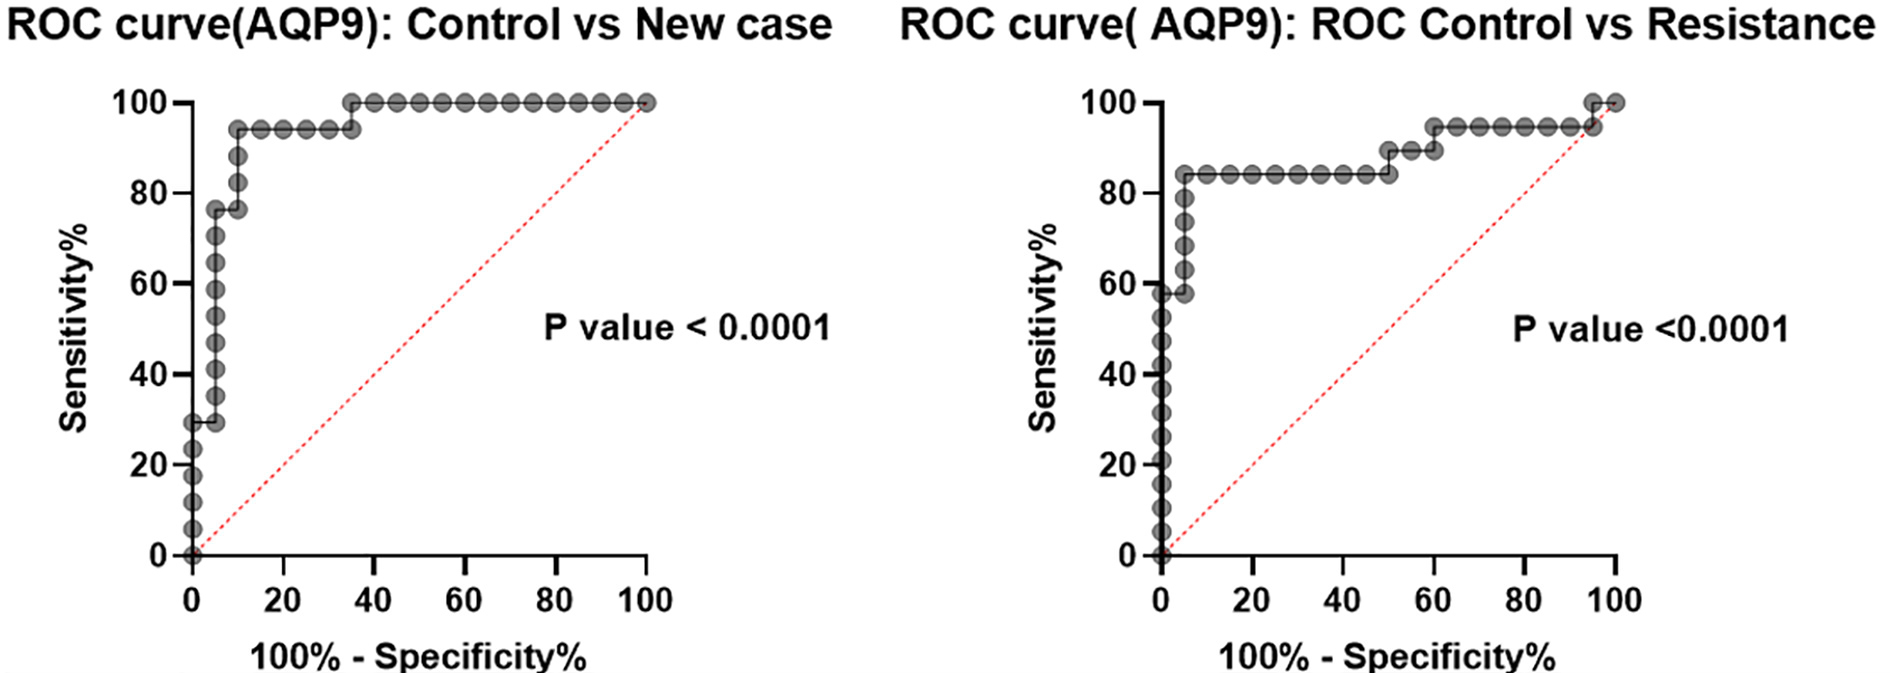
Figure 5. ROC curve analysis of AQP9 expression demonstrates its ability to discriminate UC patients from healthy controls. ROC analysis comparing newly diagnosed UC patients versus controls showed an AUC of 0.9382 (SE=0.04109; 95% CI: 0.8577-1.000; P<0.0001). ROC analysis comparing treatment-resistant UC patients versus controls yielded an AUC of 0.8789 (SE=0.06258; 95% CI: 0.7563-1.000; P<0.0001). Sensitivity and specificity values were calculated at the optimal cutoff determined using the Youden index in GraphPad Prism. These results indicate that AQP9 exhibits strong discriminatory performance as a candidate tissue biomarker for UC. ROC: Receiver operating characteristic; AUC: area under the curve; UC: Ulcerative colitis; AQP9: Aquaporin-9; SE: Standard error
Discussion
This study set out to determine the key genes of NET formation in IBD patients compared to healthy individuals. Bioinformatic analysis led us to focus on five genes, including FCGR3B, AQP9, FPR1, FPR2, and NCF2. Our findings indicated that the AQP9 gene was not only significantly upregulated in the new cases and the resistant patients compared with the control group, but it also showed a candidate tissue biomarker in UC patients.
AQP9 is an aquaglyceroporin expressed in immune cells, including neutrophils, where it contributes to water and solute transport processes that are important for inflammatory responses. Recent work in sepsis indicates that dysregulated aquaporin function, including AQP9, can modulate leukocyte recruitment and inflammatory injury, suggesting that altered AQP9 activity may influence neutrophildriven tissue damage in severe inflammation. Moreover, integrative transcriptomic analyses have shown that AQP9 expression correlates with neutrophil infiltration and other immune signatures in diverse diseases, supporting its role as an immunerelated gene, although direct mechanistic evidence linking AQP9 to NETosis in UC is still limited and warrants further investigation. 28 , 29
In general, AQP genes are responsible for water channels, playing an essential role in maintaining water homeostasis in various tissues. They are strongly associated with IBD progression. Escudero and colleagues revealed that Aquaporin 8 (AQP8), as part of this family, was downregulated in collagenous colitis, while its expression was reversed upon corticosteroid therapy. 30 Consistently, Ricanek and colleagues showed that the expression of Aquaporin 3 (AQP3), 7, and 8 was reduced in IBD patients. 31 Moreover, Bing Yu and others showed that AQP9 expression was suppressed in Crohn’s disease (CD), with a high diagnostic value. 32 By contrast, Minhoa Yu and colleagues showed that in a refractory model of CD, AQP9 expression was increased constantly. They demonstrated that anti-TNF therapy was more effective when complemented with inhibiting AQP9, whereby blocking AQP9 decreased inflamed macrophage functions and cytokine expression, especially IL-23 and IL-1β. 33 These findings, together with our data in UC, suggest that AQP expression patterns in IBD are highly contextdependent and tightly regulated to preserve intestinal homeostasis, and that disruption of this balance may contribute to disease onset and progression. Our results support the potential of AQP9 for distinguishing UC patients from healthy individuals, while also underscoring the need for mechanistic studies to clarify how modulation of AQP9 expression could be exploited therapeutically in UC.
FPR1 and FPR2, which play critical roles in neutrophil chemotaxis and chronic inflammation, were other genes involved in NET formation that were upregulated in patient groups. McAllister and others discovered that FPR1 drives neutrophilic inflammation, leading to the development of IBD. 34 Furthermore, FPR1 strongly contributes to the progression of CD by promoting macrophage M1 polarization. 35 Similarly, FPR2 is highly expressed on neutrophils, where it drives their recruitment to inflamed colonic tissue. The interaction of FPR2 with damage-associated molecular patterns (DAMPs) and with pathogen-associated molecular patterns (PAMPs) leads to neutrophil activation and NET formation. Implantation of NETs in the intestinal mucosa of IBD patients, with continued accumulation, results in functional epithelial barrier disruption, immune cell recruitment, and sustained inflammation. 36 This concept is also supported by our findings, considering the upregulation of FPR2 in UC, which could contribute to exaggerated neutrophil-driven tissue damage. NET degradation defects have been implicated in IBD; therefore, FPR2-mediated NET may have a significant role in disease worsening. Collectively, it seems that co-expression of FPR1 and FPR2 causes IBD exacerbation through sustained hyperactivation of NET formation and macrophage M1 polarization. Therefore, targeting FPR1 and FPR2 could be a novel or complementary approach in the therapy for IBD.
NCF2 and FCGR3B were other candidate genes in the current study, and we did not find meaningful changes in their expression in the studied groups. There is little evidence to support NCF2’s contribution to IBD development. Muise and colleagues reported that a missense variant in NCF2 might be associated with the onset of IBD. 25 There is also a weak association between FCGR3B and IBD, although the allele copy number of FCGR3B may have a significant association with UC susceptibility. 37 We suggest that NET formation is key to promoting both UC and CD, as supported by strong evidence, and AQP9, FPR1, and FPR2 are critical in its formation. In the present study, we demonstrated that these three genes were upregulated in UC patients, suggesting these genes ensure the maintenance of activation of NET formation. We suggest inhibiting these genes as a complementary treatment alongside standard medical approaches for UC patients.
Several limitations must be acknowledged in this study. Firstly, smoking status, active infections, and medication use were not fully controlled, as these factors may affect mucosal gene expression profiles and potentially confound biomarker discovery. Although patients with immune deficiencies were excluded, detailed records of smoking history and concurrent medications were not systematically collected due to constraints related to the sample size. Secondly, this cross-sectional design allows for the establishment of associations but does not prove causality between NET gene expression and the pathogenesis of UC. Thirdly, the relatively small sample size (n=60) limits the statistical power for subgroup analyses, particularly when comparing new and refractory UC patients. Finally, functional assays to confirm direct NET formation by the upregulated genes were not conducted. Future studies should involve larger cohorts, prospective designs, matched controls for confounding variables, and the validation of functional assays.
Conclusion
AQP9, FPR1, and FPR2 are candidate tissue biomarkers for UC, with AQP9 demonstrating excellent discriminatory performance. Further multi-center validation studies are necessary to confirm their clinical utility and establish their role in UC diagnosis.
Acknowledgment
The authors sincerely thank Kurdistan University of Medical Sciences. This study is extracted from the thesis of Hawra Zia Hossein al-Jamali (MSc), with grant number IR.MUK.REC.1403.285.
Authors’ Contribution
H.A: Conceptualization, Funding acquisition, conducted experimental stages, data collection, and drafting; S.F: Conceptualization, study design, bioinformatics analyses, writing the final report, and drafting; M.M: Statistical analysis, manuscript writing and editing; A.A, A.J, and M.R.R: Sample collection, experimental stages, and reviewing the manuscript; B.N, as a pathologist, and F.S, as a gastroenterologist: Patient identification and editing the final draft of the manuscript. All authors have thoroughly reviewed and approved the final manuscript and agree to take full responsibility for all aspects of the work, ensuring that any questions concerning the accuracy or integrity of any part of the work are properly addressed.
Declaration of AI
The authors declare that no AI tools were used in the preparation of this manuscript.
Conflict of Interest
None declared.
References
- Sosna B, Aebisher D, Myśliwiec A, Dynarowicz K, Bartusik-Aebisher D, Oleś P, et al. Selected Cytokines and Metalloproteinases in Inflammatory Bowel Disease. Int J Mol Sci. 2023; 25Publisher Full Text | DOI | PubMed [ PMC Free Article ]
- Tanwar P, Naagar M, Maity MK. A review on Ulcerative Colitis: Epidemiology, Risk Factors, Pathophysiology, Diagnosis, Clinical Management and Treatment Modalities. International Journal of Enhanced Research in Medicines & Dental Care. 2023; 10:15-29.
- Langan RC, Gotsch PB, Krafczyk MA, Skillinge DD. Ulcerative colitis: diagnosis and treatment. Am Fam Physician. 2007; 76:1323-30. PubMed
- Burri E, Maillard MH, Schoepfer AM, Seibold F, Van Assche G, Rivière P, et al. Treatment Algorithm for Mild and Moderate-to-Severe Ulcerative Colitis: An Update. Digestion. 2020; 101:2-15. DOI | PubMed
- van Lierop PP, Samsom JN, Escher JC, Nieuwenhuis EE. Role of the innate immune system in the pathogenesis of inflammatory bowel disease. J Pediatr Gastroenterol Nutr. 2009; 48:142-51. DOI | PubMed
- Shen ZH, Zhu CX, Quan YS, Yang ZY, Wu S, Luo WW, et al. Relationship between intestinal microbiota and ulcerative colitis: Mechanisms and clinical application of probiotics and fecal microbiota transplantation. World J Gastroenterol. 2018; 24:5-14. Publisher Full Text | DOI | PubMed [ PMC Free Article ]
- Zhou G, Yu L, Fang L, Yang W, Yu T, Miao Y, et al. CD177(+) neutrophils as functionally activated neutrophils negatively regulate IBD. Gut. 2018; 67:1052-63. DOI | PubMed
- Fukunaga S, Kuwaki K, Mitsuyama K, Takedatsu H, Yoshioka S, Yamasaki H, et al. Detection of calprotectin in inflammatory bowel disease: Fecal and serum levels and immunohistochemical localization. Int J Mol Med. 2018; 41:107-18. Publisher Full Text | DOI | PubMed [ PMC Free Article ]
- Drury B, Hardisty G, Gray RD, Ho GT. Neutrophil Extracellular Traps in Inflammatory Bowel Disease: Pathogenic Mechanisms and Clinical Translation. Cell Mol Gastroenterol Hepatol. 2021; 12:321-33. Publisher Full Text | DOI | PubMed [ PMC Free Article ]
- Long D, Mao C, Xu Y, Zhu Y. The emerging role of neutrophil extracellular traps in ulcerative colitis. Front Immunol. 2024; 15:1425251. Publisher Full Text | DOI | PubMed [ PMC Free Article ]
- Josefs T, Barrett TJ, Brown EJ, Quezada A, Wu X, Voisin M, et al. Neutrophil extracellular traps promote macrophage inflammation and impair atherosclerosis resolution in diabetic mice. JCI Insight. 2020; 5Publisher Full Text | DOI | PubMed [ PMC Free Article ]
- Kim TS, Silva LM, Theofilou VI, Greenwell-Wild T, Li L, Williams DW, et al. Neutrophil extracellular traps and extracellular histones potentiate IL-17 inflammation in periodontitis. J Exp Med. 2023; 220Publisher Full Text | DOI | PubMed [ PMC Free Article ]
- Zhang Y, Guo L, Dai Q, Shang B, Xiao T, Di X, et al. A signature for pan-cancer prognosis based on neutrophil extracellular traps. J Immunother Cancer. 2022; 10Publisher Full Text | DOI | PubMed [ PMC Free Article ]
- Li J, Liu Y, Sun Z, Zeng S, Zheng C. Identification of neutrophil extracellular trap-related biomarkers in ulcerative colitis based on bioinformatics and machine learning. Front Genet. 2025; 16:1589999. Publisher Full Text | DOI | PubMed [ PMC Free Article ]
- Xv Y, Feng Y, Lin J. CXCR1 and CXCR2 are potential neutrophil extracellular trap-related treatment targets in ulcerative colitis: insights from Mendelian randomization, colocalization and transcriptomic analysis. Front Immunol. 2024; 15:1425363. Publisher Full Text | DOI | PubMed [ PMC Free Article ]
- Ou J, Li L, Zhi F, Huang B, Zhao X. Developing models for the diagnosing of ulcerative colitis and prognosis of anti-TNF-α non-response based on neutrophil extracellular trap-associated genes. Front Immunol. 2025; 16:1530508. Publisher Full Text | DOI | PubMed [ PMC Free Article ]
- Alemán OR, Mora N, Cortes-Vieyra R, Uribe-Querol E, Rosales C. Differential Use of Human Neutrophil Fcγ Receptors for Inducing Neutrophil Extracellular Trap Formation. J Immunol Res. 2016; 2016:2908034. Publisher Full Text | DOI | PubMed [ PMC Free Article ]
- Liang P, Zhu M, Sun X, Wang L, Li B, Ming S, et al. LncRNA-mRNA co-expression analysis reveals aquaporin-9-promoted neutrophil extracellular trap formation and inflammatory activation in sepsis. Int Immunopharmacol. 2024; 140:112916. DOI | PubMed
- da Silva IV, Garra S, Calamita G, Soveral G. The Multifaceted Role of Aquaporin-9 in Health and Its Potential as a Clinical Biomarker. Biomolecules. 2022; 12Publisher Full Text | DOI | PubMed [ PMC Free Article ]
- Nafiz TN, Sankar P, Mishra LK, Rousseau RP, Saqib M, Subbian S, et al. Differential requirement of formyl peptide receptor 1 in macrophages and neutrophils in the host defense against Mycobacterium tuberculosis Infection. Sci Rep. 2024; 14:23595. Publisher Full Text | DOI | PubMed [ PMC Free Article ]
- Lou X, Chen H, Chen S, Ji H, He T, Chen H, et al. LL37/FPR2 regulates neutrophil mPTP promoting the development of neutrophil extracellular traps in diabetic retinopathy. Faseb j. 2024; 38:e23697. DOI | PubMed
- Yi X, Tran E, Odiba JO, Qin CX, Ritchie RH, Baell JB. The formyl peptide receptors FPR1 and FPR2 as targets for inflammatory disorders: recent advances in the development of small-molecule agonists. Eur J Med Chem. 2024; 265:115989. DOI | PubMed
- Song Z, Yoo DG, Idol RA, Barbu EA, Jacob CO, Dinauer MC. Lupus-associated NCF2 variant p.R395W in the NADPH oxidase 2 complex results in a reduced production of reactive oxygen species by myeloid cells. Front Lupus. 2023; 1:1186641. DOI
- Garley M, Dziemiańczyk-Pakieła D, Ratajczak-Wrona W, Pryczynicz A, Nowak K, Łazarczyk B, et al. NETs biomarkers in saliva and serum OSCC patients: One hypothesis, two conclusions. Adv Med Sci. 2022; 67:45-54. DOI | PubMed
- Muise AM, Xu W, Guo CH, Walters TD, Wolters VM, Fattouh R, et al. NADPH oxidase complex and IBD candidate gene studies: identification of a rare variant in NCF2 that results in reduced binding to RAC2. Gut. 2012; 61:1028-35. Publisher Full Text | DOI | PubMed [ PMC Free Article ]
- Fakhari S, Moradzad M, Ahmadi A, Hekmatnia M, Jalili A, Nikkhoo B, et al. Downregulation of MT2-MMP and MT5-MMP in ulcerative colitis serves a diagnostic predictor and potential therapeutic targets. Mol Biol Rep. 2025; 52:359. DOI | PubMed
- Schmittgen TD, Livak KJ. Analyzing real-time PCR data by the comparative C(T) method. Nat Protoc. 2008; 3:1101-8. DOI | PubMed
- Rump K, Adamzik M. Aquaporins in sepsis- an update. Front Immunol. 2024; 15:1495206. Publisher Full Text | DOI | PubMed [ PMC Free Article ]
- Liu X, Xu Q, Li Z, Xiong B. Integrated analysis identifies AQP9 correlates with immune infiltration and acts as a prognosticator in multiple cancers. Sci Rep. 2020; 10:20795. Publisher Full Text | DOI | PubMed [ PMC Free Article ]
- Escudero-Hernández C, Münch A, Østvik AE, Granlund AVB, Koch S. The Water Channel Aquaporin 8 is a Critical Regulator of Intestinal Fluid Homeostasis in Collagenous Colitis. J Crohns Colitis. 2020; 14:962-73. Publisher Full Text | DOI | PubMed [ PMC Free Article ]
- Ricanek P, Lunde LK, Frye SA, Støen M, Nygård S, Morth JP, et al. Reduced expression of aquaporins in human intestinal mucosa in early stage inflammatory bowel disease. Clin Exp Gastroenterol. 2015; 8:49-67. Publisher Full Text | DOI | PubMed [ PMC Free Article ]
- Yu B, Yin YX, Tang YP, Wei KL, Pan ZG, Li KZ, et al. Diagnostic and Predictive Value of Immune-Related Genes in Crohn’s Disease. Front Immunol. 2021; 12:643036. Publisher Full Text | DOI | PubMed [ PMC Free Article ]
- Yu M, Shi Y, Gao Y, Luo Y, Jin Y, Liang X, et al. Targeting AQP9 enhanced the anti-TNF therapy response in Crohn’s disease by inhibiting LPA-hippo pathway. Pharmacol Res. 2024; 203:107172. DOI | PubMed
- McAllister MJ, Hall R, Whelan RJ, Fischer LJ, Chuah CS, Cartlidge PD, et al. Formylated Peptide Receptor-1-Mediated Gut Inflammation as a Therapeutic Target in Inflammatory Bowel Disease. Crohns Colitis 360. 2024; 6:otae003. Publisher Full Text | DOI | PubMed [ PMC Free Article ]
- Ye C, Zhu S, Yuan J, Yuan X. FPR1, as a Potential Biomarker of Diagnosis and Infliximab Therapy Responses for Crohn’s Disease, is Related to Disease Activity, Inflammation and Macrophage Polarization. J Inflamm Res. 2024; 17:3949-66. Publisher Full Text | DOI | PubMed [ PMC Free Article ]
- Yang WS, Wang JL, Wu W, Wang GF, Yan J, Liu Q, et al. Formyl peptide receptor 2 as a potential therapeutic target for inflammatory bowel disease. Acta Pharmacol Sin. 2023; 44:19-31. Publisher Full Text | DOI | PubMed [ PMC Free Article ]
- Asano K, Matsumoto T, Umeno J, Hirano A, Esaki M, Hosono N, et al. Impact of allele copy number of polymorphisms in FCGR3A and FCGR3B genes on susceptibility to ulcerative colitis. Inflamm Bowel Dis. 2013; 19:2061-8. DOI | PubMed


