
What’s Known
Increased pyrimidine metabolism is characterized by dysregulation of the rate-limiting enzymes of this pathway. Emerging evidence highlighted the critical role of uridine cytidine kinase 2 (UCK2), deoxythymidylate kinase (DTYMK), and cytidine triphosphate synthetase 1 (CTPS1) in tumorigenesis and cancer progression. Bioinformatics analyses revealed that expression of UCK2, CTPS1, and DTYMK was increased in esophageal squamous cell carcinoma (ESCC).
What’s New
For the first time, the present study found that CTPS1 and DTYMK were overexpressed in ESCC tissues compared to adjacent healthy tissue, which could provide valuable insights for the development of esophageal cancer (EC) treatment strategies. Although UCK2 expression was elevated in tumor tissues compared with surrounding non-tumor tissues, this difference was not statistically significant.
Introduction
In 2020, esophageal cancer (EC) ranked seventh in incidence and sixth in overall mortality worldwide.1 Esophageal cancers are primarily classified into two main histological types, including esophageal adenocarcinoma and esophageal squamous cell carcinoma (ESCC).2 ESCC typically involves the middle and upper part of the esophagus and is considered the most common histological subtype of EC.3 In 2020, the global incidence of EC exceeded 600,000 cases, and mortality reached 540,000.4 Northeastern Iran is recognized as one of the regions with the highest incidence of EC worldwide. Specifically, the incidence of ESCC is notably high in Golestan Province, Iran.5, 6 Despite recent advances in the diagnosis and treatment of ESCC, the 5-year survival rate remains below 20%.7 In addition, the abnormal expression of certain genes may contribute to the pathogenesis of this disease. Consequently, identifying novel biomarkers and therapeutic targets is essential for improving clinical outcomes and advancing EC research.
One of the prominent characteristics of cancer cells is metabolic reprogramming, which contributes to tumor growth and progression. Tumor cells reprogram metabolic pathways due to increased demand for nucleotides and other essential building blocks for cell survival and rapid growth.8, 9 Pyrimidine metabolism is frequently altered during cancer progression, a change reflected by the dysregulation of the rate-limiting enzymes (RLE) in this pathway.10, 11 Altered expression of RLE in pyrimidine biosynthesis has been observed in various cancers. Uridine cytidine kinase 2 (UCK2) is an RLE in the salvage pathway of pyrimidine biosynthesis. It can phosphorylate cytidine and uridine and convert them to monophosphate forms.12 Several studies demonstrated that UCK2 is upregulated in cancer tissues.13-15 Cytidine triphosphate synthetase 1 (CTPS1) catalyzes the rate-limiting step of CTP synthesis using UTP, Glutamine, and adenosine triphosphate (ATP).16 Furthermore, CTPS1 was shown to be upregulated in tumor cells.17-19DTYMK catalyzes the generation of deoxythymidine diphosphate (dTDP) from deoxythymidine monophosphate (dTMP). It represents the first convergent step of salvage and de novo pathways, leading to the production of dTTP, an essential nucleotide for DNA synthesis. In recent years, the roles of DTYMK in cancer development and its relationship with cell signaling pathways have attracted considerable research interest.20 Reports indicated that DTYMK knockdown reduced tumor growth and formation in nude mice with hepatocellular carcinoma (HCC) transplanted carcinoma.21 A previous study focused on gene expression changes using different datasets in ESCC. Based on these bioinformatics data, the expression of UCK2, CTPS1, and DTYMK has been reported to be increased in ESCC.22
However, the expression profiles of these pyrimidine metabolism-related genes in ESCC remain unclear. Therefore, we aimed to examine the expression of UCK2, CTPS1, and DTYMK in ESCC tissues compared with adjacent healthy tissues, with the goal of identifying potential therapeutic targets to improve clinical outcomes.
Materials and Methods
GENT2 and OncoDB Databases
The GENT2 and OncoDB databases are online platforms used to examine gene expression patterns in various cancers and healthy tissues. Initially, the expression of UCK2, CTPS1, and DTYMK genes was investigated in 184 EC tissues compared with 13 normal tissues, based on ribonucleic acid (RNA) sequencing data from the OncoDB database. Moreover, the expression of these genes was explored in 236 EC tissues relative to 24 healthy tissues using microarray data from the GENT2 database, which included the following datasets: GSE26886, GSE33810, GSE7307, GSE2109, GSE45670, GSE63941, GSE17351, GSE43346, GSE21293, GSE22954, GSE34111, GSE51021, and GSE42363.
Tissue Samples
The sample size of this study was calculated based on a pilot study on 10 tissue samples using G*Power 3.1.9.2 software (Heinrich Heine University Düsseldorf, Düsseldorf, Germany). A one-tailed Wilcoxon matched-pairs signed-rank test was selected, with statistical power (1-β) set to 0.8, and the α error probability set to 0.05. The mean fold change±SD obtained from the pilot study was 4.835±10.484 for DTYMK, 10.517±20.031 for CTPS1, and 4.174±9.854 for UCK2. Based on these parameters, a minimum sample size of 28 pairs was estimated. However, 34 subjects were ultimately included in this study.
In this cross-sectional study, 34 pairs of newly diagnosed ESCC and adjacent healthy tissue samples were obtained from Golestan Cancer Bio Bank (Gorgan, Iran) and the Iran National Tumor Bank of the Cancer Institute at Imam Khomeini Hospital (Tehran, Iran). This study was conducted at Golestan University of Medical Sciences (Gorgan, Iran) in 2023. Patients with newly diagnosed ESCC were included. Individuals with comorbidities or those providing samples of inadequate quality that would disrupt data interpretation were excluded. All patients provided written informed consent, and the study was approved by the Ethics Committee of Golestan University of Medical Sciences (approval code: IR.GOUMS.REC.1401.395).
cDNA Synthesis
First, the tumor and adjacent healthy tissues were pulverized using liquid nitrogen. Total RNA was extracted from the tissues using the RNX-PLUS kit (SinaClon, Iran) according to the manufacturer’s instructions. The concentration of the purified RNA was measured using a NanoDrop spectrophotometer (DeNovix, USA). Potential DNA contamination was removed from the RNA samples using DNase I (Thermo Fisher Scientific, USA). Subsequently, cDNA was synthesized from 1000 ng of total RNA using random hexamer and oligo (dT) primers, according to the Yekta Tajhiz Azma Kit protocol.
Real-Time Quantitative PCR (RT-qPCR)
RT-qPCR was performed on an Applied Biosystems (ABI) instrument (Applied Biosystems, USA), and the sequences of the corresponding primers are shown in table 1. The RT-qPCR was done using SYBR Green master mix (Ampliqon, Denmark) under the following conditions: initial denaturation at 95 °C for 15 min, followed by 40 cycles of 10 s at 95 °C, 30 s at 62 °C, and 40 s at 72 °C. The relative gene expression was normalized to 18S rRNA (as an internal reference gene) and calculated using the 2-ΔΔCt method.
| Genes | Sequences (5′ to 3′) |
|---|---|
| UCK2-F | GGGGCAGAATGAGGTGGACTAT |
| UCK2-R | GAGGTAAGGACACGGTAGAAGC |
| DTYMK-F | CCAGACCCCACAACTTCAGGA |
| DTYMK-R | CAACAGAGTGCCATCAGGACAG |
| CTPS1-F | GTCTCATCCATCTACCGAGTCC |
| CTPS1-R | CACAAGGGCAATAGAGCAGGTC |
| 18S rRNA-F | GGCGGCTTTGGTGACTCTAG |
| 18S rRNA-R | CGGTGCGGGAGTGGGTAATT |
| UCK2: Uridine cytidine kinase 2; DTYMK: Deoxythymidylate kinase; CTPS1: Cytidine triphosphate synthetase 1; 18S rRNA: 18S ribosomal RNA | |
Statistical Analysis
After assessing the normality of the data using the Shapiro-Wilk test, the Mann-Whitney U test was performed to compare the expression of all three genes between tumor and normal tissue groups based on the database-derived data. Subsequently, the Wilcoxon matched-pairs signed rank test was used to analyze the expression changes (fold change) of the UCK2, DTYMK, and CTPS1 genes in tumor tissue compared with adjacent healthy tissues. Moreover, the Mann-Whitney U test was used to compare gene expression (fold change) across different subgroups based on sex, age, grade, and tumor size. Spearman’s rank correlation analysis was used to evaluate the correlation between the expression of DTYMK, UCK2, and CTPS1 genes. P<0.05 was considered statistically significant.
Results
Examination of Gene Expression Databases
The expression pattern of the UCK2, DTYMK, and CTPS1 genes in EC and normal tissues was explored using the GENT2 and OncoDB databases. Data were reported as median and interquartile range (IQR; Q1–Q3). As shown in figure 1A, there was a significant elevation in the expression of the UCK2, CTPS1, and DTYMK genes in tumor tissues relative to healthy tissues, based on the OncoDB database.
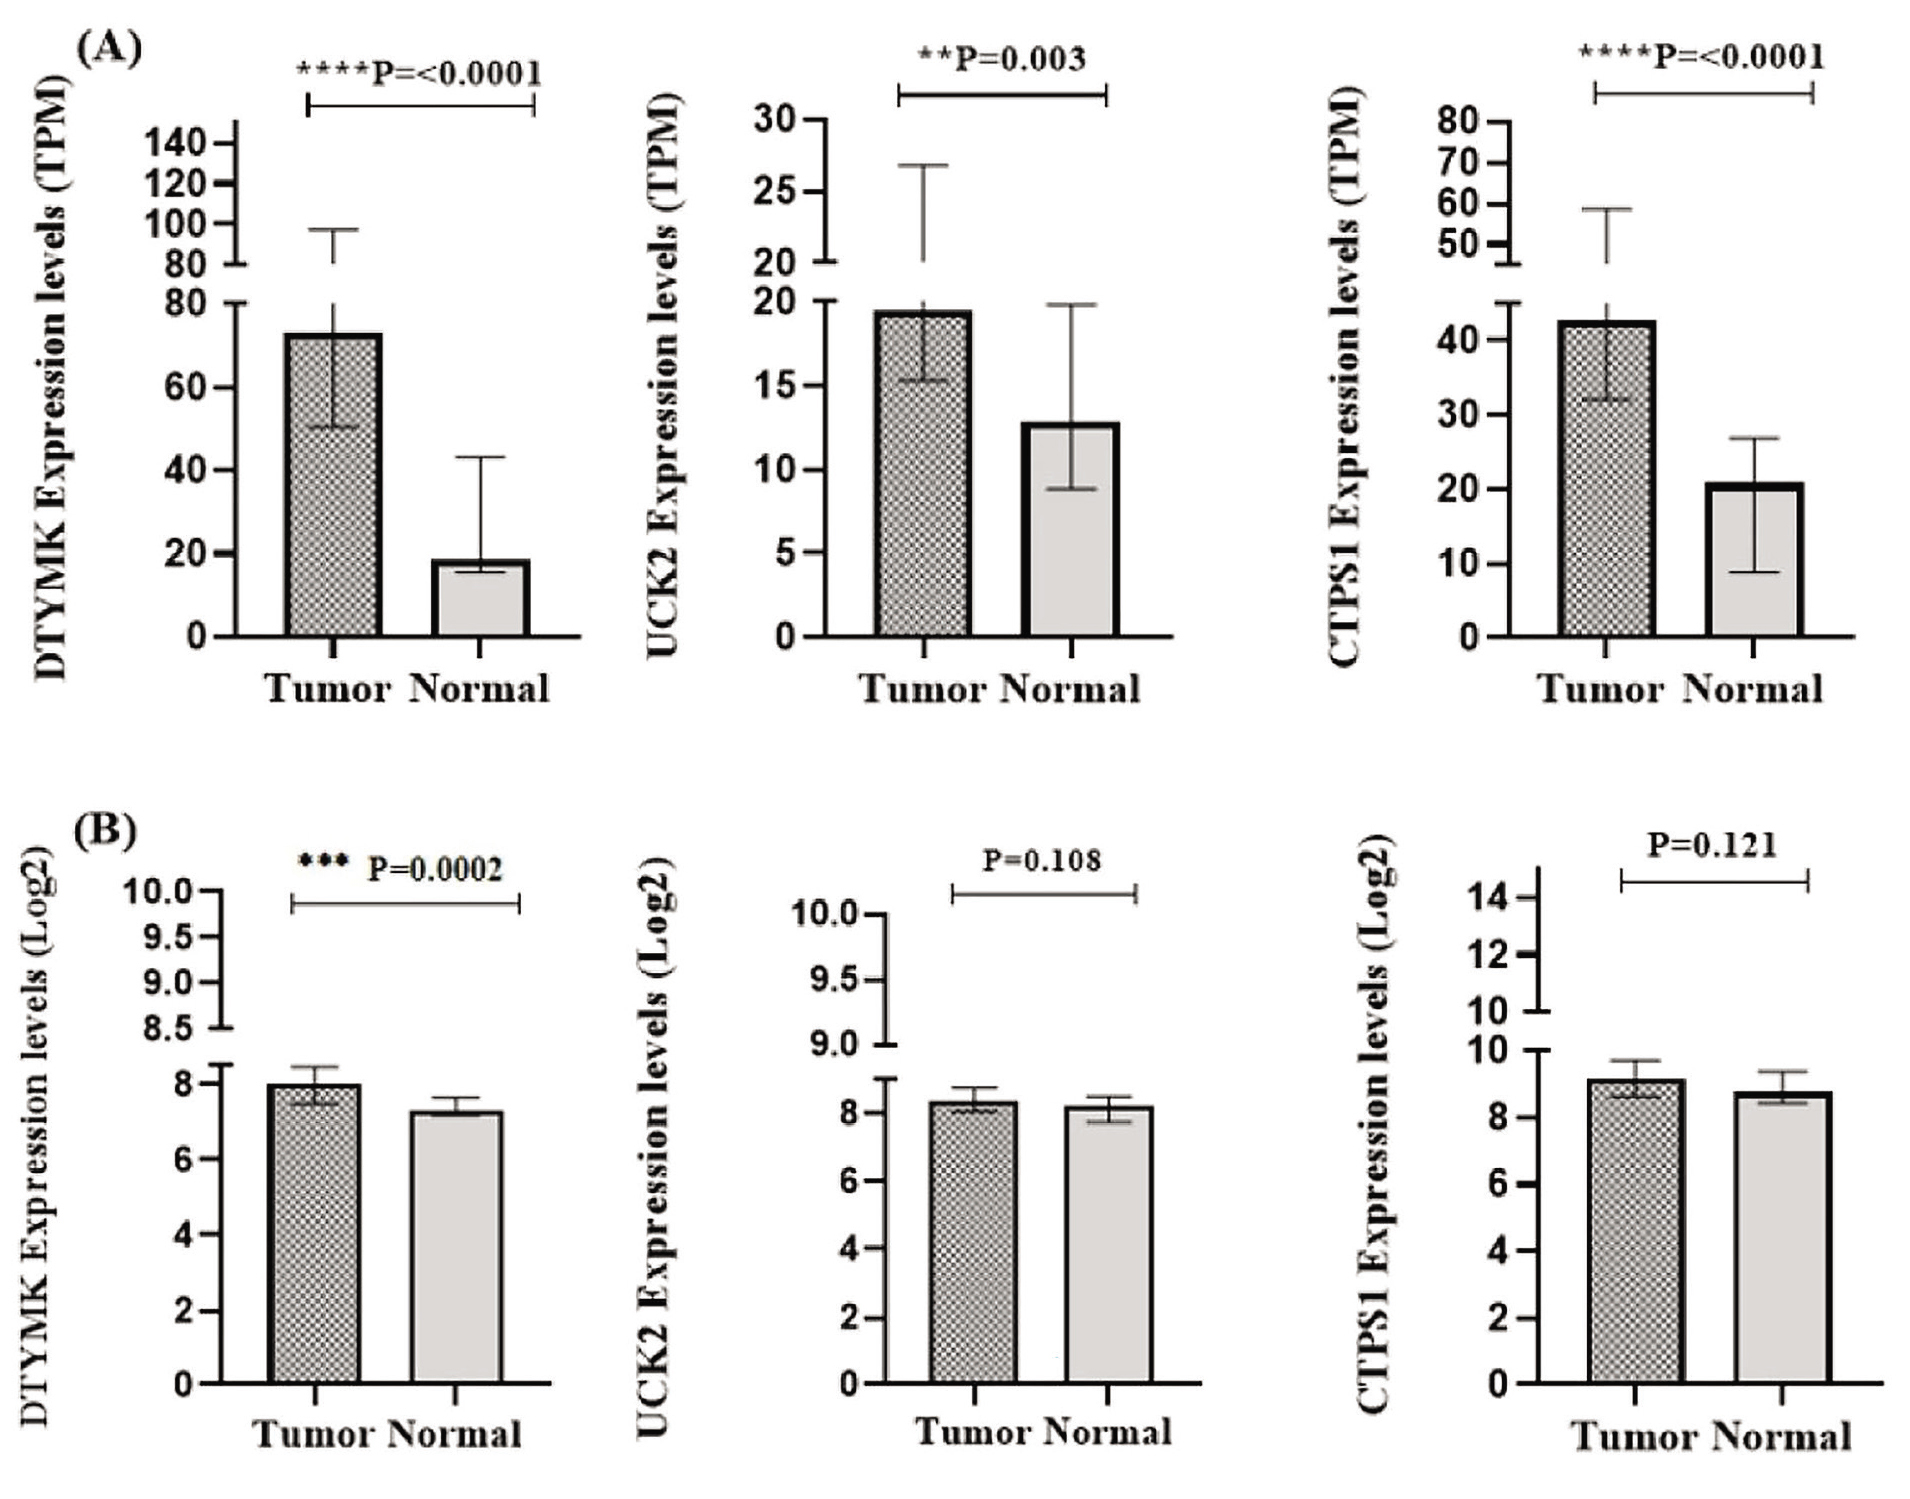
Figure 1.This figure illustrates gene expression of DTYMK, UCK2, and CTPS1 in databases. (A) Data are reported as median and IQR (Q1-Q3). The expression of genes UCK2 (19.47 and 15.30-26.81 vs. 12.84 and 8.82-19.83, P=0.003), CTPS1 (42.66 and 32.08-58.63 vs. 20.84 and 8.78-26.87, P<0.0001) and DTYMK (73.35 and 50.48-97.52 vs. 18.80 and 15.54-43.24, P<0.0001) were upregulated in tumor tissues relative to healthy tissues in OncoDB database. (B) DTYMK expression was increased in tumor tissues (8.02 and 7.49-8.47 vs. 7.33 and 7.18-7.65, P=0.0002). However, no statistically significant difference was observed for UCK2 (8.41 and 8.06-8.77 vs. 8.22 and 7.75-8.52, P=0.108) and CTPS1 (9.18 and 8.63-9.71 vs. 8.76 and 8.43-9.37, P=0.121) expression between cancer and healthy tissues. **P=0.003, ***P=0.0002, ****P<0.0001; UCK2: Uridine cytidine kinase 2; DTYMK: Deoxythymidylate kinase; CTPS1: Cytidine triphosphate synthetase 1; P<0.05 was considered statistically significant.
Furthermore, according to the GENT2 database result, DTYMK expression was upregulated in EC tissues compared to normal tissues. However, no statistically significant difference was observed in UCK2 and CTPS1 expression between healthy and cancerous tissues (figure 1B).
Examination of Gene Expression in EC Tissues
The mean age of the study participants was 69.6±2.19 years, with 55.9% being female and 44.1% male. The mRNA expression of UCK2, CTPS1, and DTYMK was compared between tumor and adjacent healthy tissues. Data were reported as median and IQR (Q1-Q3). The results illustrated that CTPS1 and DTYMK expression levels in EC tissue were higher than those in adjacent healthy tissues. The expression levels of the UCK2 gene were increased in cancer tissues compared to surrounding non-tumor tissues. However, this increase was not statistically significant (figure 2).
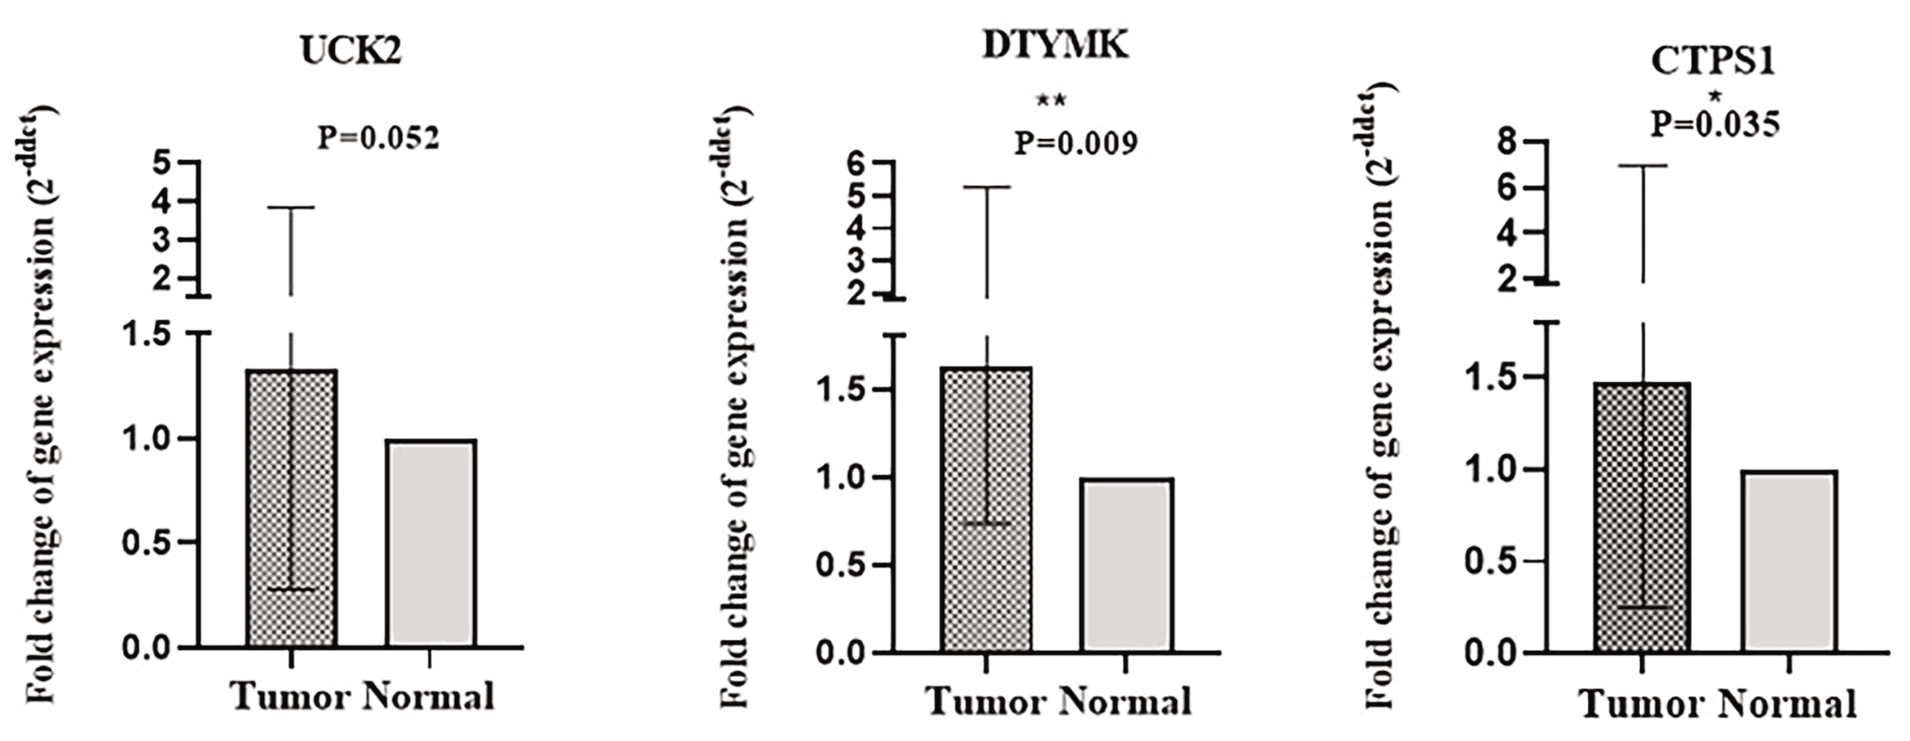
Figure 2.This figure illustrates gene expression of DTYMK, UCK2, and CTPS1 in esophageal cancer tissues. Data are reported as median and IQR (Q1-Q3). CTPS1 (1.47 and 0.246-6.964, P=0.035) and DTYMK (1.62 and 0.733-5.278, P=0.009) expression levels were enhanced in esophageal cancer tissue relative to adjacent healthy tissues. UCK2 (1.32 and 0.278-3.834, P=0.052) was upregulated in EC tissues compared to surrounding healthy tissues. However, it was not statistically significant. *P=0.035, **P=0.009; UCK2: Uridine cytidine kinase 2; DTYMK: Deoxythymidylate kinase; CTPS1: Cytidine triphosphate synthetase 1; P<0.05 was considered statistically significant.
Examination of Gene Expression Based on Demographic and Pathologic Characteristics
To examine whether there was a relationship between expression levels of three target genes and pathological and demographic characteristics, including age, grade, tumor size, and sex, the studied subjects were grouped according to age (39-64 years and 65-92 years), grade (well-differentiated and moderately/poorly differentiated), tumor size (<5 cm and ≥5 cm) and sex (male and female). Our findings showed that DTYMK expression in females was higher than in males. No significant differences were observed in the expression levels of the three genes among other subgroups. The results are presented in table 2.
| Variable | Genes | Group | Median | IQR (Q1-Q3) | P value |
|---|---|---|---|---|---|
| Sex | DTYMK | Male | 0.81 | 0.213-1.624 | 0.007 |
| Female | 3.73 | 1.505-11.313 | |||
| UCK2 | Male | 0.57 | 0.162-3.732 | 0.202 | |
| Female | 1.51 | 0.574-6.498 | |||
| CTPS1 | Male | 0.80 | 0.117-6.093 | 0.274 | |
| Female | 3.02 | 0.563-7.366 | |||
| Age | DTYMK | 39-64 | 1.62 | 0.759-3.681 | 1 |
| 65-92 | 1.62 | 0.435-6.498 | |||
| UCK2 | 39-64 | 1.93 | 0.264-4.846 | 0.867 | |
| 65-92 | 1.24 | 0.219-3.611 | |||
| CTPS1 | 39-64 | 1.19 | 0.535-22.627 | 0.427 | |
| 65-92 | 1.62 | 0.101-5.656 | |||
| Grade | DTYMK | Well-differentiated | 1.41 | 0.301-3.681 | 0.235 |
| Moderately/poorly-differentiated | 1.86 | 1.368-8.905 | |||
| UCK2 | Well-differentiated | 1.37 | 0.179-5.908 | 0.664 | |
| Moderately/poorly-differentiated | 1.65 | 0.374-3.611 | |||
| CTPS1 | Well-differentiated | 0.65 | 0.339-4.141 | 0.382 | |
| Moderately/poorly-differentiated | 3.02 | 0.311-7.844 | |||
| Tumor size | DTYMK | <5 cm | 2.67 | 0.985-13.494 | 0.395 |
| ≥5 cm | 1.62 | 0.435-5.278 | |||
| UCK2 | <5 cm | 1.89 | 0.707-8.574 | 0.317 | |
| ≥5 cm | 1.93 | 0.173-4.423 | |||
| CTPS1 | <5 cm | 1.31 | 0.865-3.028 | 0.605 | |
| ≥5 cm | 0.40 | 0.052-7.769 | |||
| UCK2: Uridine cytidine kinase 2; DTYMK: Deoxythymidylate kinase; CTPS1: Cytidine triphosphate synthetase 1; The Mann-Whitney test was used to compare gene expression (fold change) across different groupings based on sex, age, grade, and tumor size. P<0.05 was considered statistically significant. | |||||
As expected, Spearman’s correlation analysis revealed significant correlations between expression levels of DTYMK, UCK2, and CTPS1. There were significant correlations between DTYMK and UCK2, and between DTYMK and CTPS1. No correlation was observed between CTPS1 and UCK2 (table 3).
| Genes | DTYMK | CTPS1 | UCK2 | |
|---|---|---|---|---|
| DTYMK | Correlation Coefficient | 1 | 0.475* | 0.496** |
| P value | - | 0.016 | 0.007 | |
| CTPS1 | Correlation Coefficient | 0.475* | 1 | 0.333 |
| P value | 0.016 | - | 0.097 | |
| UCK2 | Correlation Coefficient | 0.496** | 0.333 | 1 |
| P value | 0.007 | 0.097 | - | |
| UCK2: Uridine cytidine kinase 2; DTYMK: Deoxythymidylate kinase; CTPS1: Cytidine triphosphate synthetase 1; *, **Spearman’s correlation analysis was used to measure the correlation between the expression of DTYMK, UCK2, and CTPS1 genes. P<0.05 was considered statistically significant. | ||||
Discussion
This study examined the expression profile of RLE within the pyrimidine synthesis pathway in ESCC tissues and adjacent non-tumor tissues. The findings of the present study demonstrated the upregulation of these genes in cancer tissues, suggesting a vital role for pyrimidine metabolism in the progression of EC. Metabolic reprogramming is considered one of the main characteristics of cancer. The metabolic demands for DNA replication and nucleotide synthesis are increased in cancer cells to maintain their survival, uncontrolled proliferation, and growth.23, 24 Using bioinformatics data, Wang and others showed that the expression of genes related to pyrimidine metabolism was elevated in 80% of cancers compared to healthy tissues, which indicated a correlation between pyrimidine metabolism and cancer development.9 Increased pyrimidine metabolism is reflected by the dysregulation of RLEs in this pathway.10UCK2, DTYMK, and CTPS1 are RLEs involved in the de novo and salvage pathways of pyrimidine synthesis. Therefore, alterations in the expression of these enzymes could be important in cancer progression.
Initially, we explored the OncoDB and GENT2 databases to examine the expression pattern of UCK2, DTYMK, and CTPS1 in EC. According to the OncoDB database, the expression of UCK2, CTPS1, and DTYMK was upregulated in tumor tissues compared to normal tissues. Based on the results obtained from the GENT2 database, DTYMK expression was increased, while no significant changes were observed in the expression of UCK2 and CTPS1 in tumor tissues compared to normal ones. These discrepancies might be attributed to differences in data sources, technical platforms, and sample sizes.
In the present study, the expression of UCK2, DTYMK, and CTPS1 was analyzed in ESCC tissues and adjacent healthy tissues. Our findings demonstrated that CTPS1 and DTYMK expression were upregulated in EC tissues compared with adjacent healthy tissues. In line with our findings, Zhang and others found that DTYMK expression was elevated in HCC tissues compared with healthy liver tissues.25 Furthermore, DTYMK expression was reported to be increased 1.6-fold in HCC compared with normal tissues,26 and upregulated in most HCC tissues as well as in HepG2, Hun7, and Hep3B HCC cell lines relative to healthy hepatic cell lines.21 It was observed that increased DTYMK was associated with worse prognosis and poor survival in patients with colorectal cancer, with DTYMK levels correlating with cancer progression and invasion.27 Another study showed that DTYMK was overexpressed in several cancers, and its upregulation was associated with more aggressive tumors.28 Consistent with our findings, the expression of CTPS1 was shown to be increased in triple-negative breast cancer (TNBC) tissues and cells.17CTPS1 and ataxia-telangiectasia and Rad3 related (ATR) inhibition enhanced cell death and reduced tumor growth in MYC-overexpressing cancer cells.29 The researchers showed that the expression of CTPS1 was upregulated in breast cancer tissues and that CTPS1 inhibition reduced migration, proliferation, and invasion in breast cancer cells.30 Furthermore, CTPS1 inhibition suppressed proliferation, induced apoptosis in lymphoid cells, and blocked the growth of B-cell and T-cell lymphomas in vivo.31 In the present investigation, UCK2 expression was enhanced in tumor tissues relative to surrounding non-tumor tissues. However, this difference was not statistically significant. Nevertheless, several studies reported that UCK2 was increased in various cancers.13, 32, 33 These discrepancies might be attributed to factors such as sample size, cancer type, technical platforms, and ethnic groups.
Few studies have reported correlations between the expressions of these target genes and demographic and pathological parameters. In this study, no significant differences were observed in the expression levels of UCK2 and CTPS1 concerning the clinicopathological characteristics, such as age, sex, tumor grade, and tumor size. Our results indicated that DTYMK expression in females was higher than in males. Consistent with some previous reports, no significant difference in UCK2 levels was observed based on age, sex, and tumor grade in pancreatic cancer.34 In another study, DTYMK levels were not associated with sex, age, tumor size, and tumor-node-metastasis (TNM) stage in hepatocellular carcinoma.26 Conversely, Zhou and others demonstrated that increased DTYMK expression was significantly correlated with sex in lung adenocarcinoma.35 Similarly, no significant correlation was found between UCK2 expression and age, sex, tumor size, and Edmondson-Steiner grade in patients with HCC.36 However, elevated CTPS1 expression was correlated with larger tumor size and higher grade in breast cancer.17 However, increased UCK2 protein levels in patients with HCC were correlated with poor differentiation grade, advanced TNM stage, and tumor size. However, no significant association was observed with age or sex.33
Overall, pyrimidine metabolic reprogramming facilitates cancer progression and growth, and understanding the changes in gene expression involved in this pathway could help in identifying suitable therapeutic targets. Nevertheless, the present study had several limitations. First, as a small cross-sectional study, it failed to fully capture the molecular diversity of EC. Second, the association of these enzymes with other pathological features was not examined. Third, enzymatic activity of these rate-limiting enzymes was not measured. Moreover, expression data alone cannot confirm mechanistic roles or therapeutic applications. Thus, further mechanistic studies are required to elucidate how these enzymes interact with signaling pathways and to evaluate the effects of their inhibition on cancer treatment. Therefore, an in-depth investigation of the genes involved in pyrimidine synthesis could provide therapeutic options for EC.
Conclusion
The experimental results demonstrated that the expression of CTPS1 and DTYMK was significantly increased in ESCC tissues compared with adjacent healthy tissues. These findings could provide valuable insights into the upregulation of genes involved in pyrimidine metabolism and highlight their importance as therapeutic targets in EC.
Acknowledgment
We would like to express our gratitude to the Iran National Tumor Bank of the Cancer Institute at Imam Khomeini Hospital and Golestan Research Center of Gastroenterology Hepatology, Golestan Cancer Biobank, Golestan University of Medical Sciences for providing the tissue samples of this study. The present article was extracted from a thesis written by Nadia Heydari. The research was supported by a grant from Golestan University of Medical Sciences (grant number: 112631).
Authors’ Contribution
N.H: Conceptualization, study design, experimental performance, data analysis, and drafting; M.SJ: Experimental performance, data analysis, and reviewing the manuscript; J.A: Conceptualization, study design, and reviewing the manuscript; M.ShA: Conceptualization, study design, and reviewing the manuscript; SM.J: Conceptualization, study design, experimental performance, data analysis, and reviewing the manuscript; All authors have read and approved the final version of the manuscript and agree to be accountable for all aspects of the work, ensuring that questions related to the accuracy or integrity of any part of the work are appropriately investigated and resolved.
Declaration of AI
The authors used ChatGPT version 5.3 (OpenAI, San Francisco, USA) to improve clarity and paraphrase some sentences. All conceptual content, data analysis, and interpretation were conducted solely by the authors.
Conflict of Interest
None declared.
References
- Sung H, Ferlay J, Siegel RL, Laversanne M, Soerjomataram I, Jemal A. Global Cancer Statistics 2020: GLOBOCAN Estimates of Incidence and Mortality Worldwide for 36 Cancers in 185 Countries. CA Cancer J Clin. 2021; 71:209-49. DOI | PubMed
- Lyu SI, Fretter C, Hillmer AM, Grothey B, Hoppe S, Simon AG. Basal-like subtype of esophageal adenocarcinoma and it’s morphological, molecular and clinical characteristics. Sci Rep. 2025; 15:24680. Publisher Full Text | DOI | PubMed [ PMC Free Article ]
- Codipilly DC, Wang KK. Squamous Cell Carcinoma of the Esophagus. Gastroenterol Clin North Am. 2022; 51:457-84. DOI | PubMed
- Liu CQ, Ma YL, Qin Q, Wang PH, Luo Y, Xu PF. Epidemiology of esophageal cancer in 2020 and projections to 2030 and 2040. Thorac Cancer. 2023; 14:3-11. Publisher Full Text | DOI | PubMed [ PMC Free Article ]
- Ghasemi-Kebria F, Semnani S, Fazel A, Etemadi A, Amiriani T, Naeimi-Tabiei M. Esophageal and gastric cancer incidence trends in Golestan, Iran: An age-period-cohort analysis 2004 to 2018. Int J Cancer. 2023; 153:73-82. DOI | PubMed
- Collaborators GBDOC. The global, regional, and national burden of oesophageal cancer and its attributable risk factors in 195 countries and territories, 1990-2017: a systematic analysis for the Global Burden of Disease Study 2017. Lancet Gastroenterol Hepatol. 2020; 5:582-97. Publisher Full Text | DOI | PubMed [ PMC Free Article ]
- Hassanipour S, Mohammadian-Hafshejani A, Ghoncheh M, Salehiniya H. The incidence and mortality of esophageal cancer and its relationship with development in the world. Biomed Res Ther. 2017; 4:1607-23. DOI
- Martinez-Outschoorn UE, Peiris-Pages M, Pestell RG, Sotgia F, Lisanti MP. Cancer metabolism: a therapeutic perspective. Nat Rev Clin Oncol. 2017; 14:11-31. DOI | PubMed
- Wang W, Cui J, Ma H, Lu W, Huang J. Targeting Pyrimidine Metabolism in the Era of Precision Cancer Medicine. Front Oncol. 2021; 11:684961. Publisher Full Text | DOI | PubMed [ PMC Free Article ]
- Yeh HW, Lee SS, Chang CY, Hu CM, Jou YS. Pyrimidine metabolic rate limiting enzymes in poorly-differentiated hepatocellular carcinoma are signature genes of cancer stemness and associated with poor prognosis. Oncotarget. 2017; 8:77734-51. Publisher Full Text | DOI | PubMed [ PMC Free Article ]
- Wang H, Wang X, Xu L, Zhang J, Cao H. High expression levels of pyrimidine metabolic rate-limiting enzymes are adverse prognostic factors in lung adenocarcinoma: a study based on The Cancer Genome Atlas and Gene Expression Omnibus datasets. Purinergic Signal. 2020; 16:347-66. Publisher Full Text | DOI | PubMed [ PMC Free Article ]
- Fu Y, Wei XD, Guo L, Wu K, Le J, Ma Y. The Metabolic and Non-Metabolic Roles of UCK2 in Tumor Progression. Front Oncol. 2022; 12:904887. Publisher Full Text | DOI | PubMed [ PMC Free Article ]
- Wu Y, Jamal M, Xie T, Sun J, Song T, Yin Q. Uridine-cytidine kinase 2 (UCK2): A potential diagnostic and prognostic biomarker for lung cancer. Cancer Sci. 2019; 110:2734-47. Publisher Full Text | DOI | PubMed [ PMC Free Article ]
- Sun W, Guo H, Cai M, Ma G, Zhang L, Yu Y. Uridine-cytidine kinase 2 as a novel potential prognostic and therapeutic biomarker in gastric cancer. Transl Cancer Res. 2025; 14:8070-85. Publisher Full Text | DOI | PubMed [ PMC Free Article ]
- Wu X, Chen D, Li M, Liang G, Ye H. UCK2 promotes intrahepatic cholangiocarcinoma progression and desensitizes cisplatin treatment by PI3K/AKT/mTOR/autophagic axis. Cell Death Discov. 2024; 10:375. Publisher Full Text | DOI | PubMed [ PMC Free Article ]
- Zhou X, Guo CJ, Chang CC, Zhong J, Hu HH, Lu GM. Structural basis for ligand binding modes of CTP synthase. Proc Natl Acad Sci U S A. 2021; 118Publisher Full Text | DOI | PubMed [ PMC Free Article ]
- Lin Y, Zhang J, Li Y, Guo W, Chen L, Chen M. CTPS1 promotes malignant progression of triple-negative breast cancer with transcriptional activation by YBX1. J Transl Med. 2022; 20:17. Publisher Full Text | DOI | PubMed [ PMC Free Article ]
- Durand R, Bellanger C, Kervoelen C, Tessoulin B, Dousset C, Menoret E. Selective pharmacologic targeting of CTPS1 shows single-agent activity and synergizes with BCL2 inhibition in aggressive mantle cell lymphoma. Haematologica. 2024; 109:2574-84. Publisher Full Text | DOI | PubMed [ PMC Free Article ]
- Pfeiffer C, Grandits AM, Asnagli H, Schneller A, Huber J, Zojer N. CTPS1 is a novel therapeutic target in multiple myeloma which synergizes with inhibition of CHEK1, ATR or WEE1. Leukemia. 2024; 38:181-92. DOI | PubMed
- Heydari N, Mahdizadeh M, Jafari SM. The evolving landscape of involvement of DTYMK enzymes in cancer. Med Oncol. 2023; 40:213. DOI | PubMed
- Sun F, Liu Y, Gong T, Pan Q, Xiang T, Zhao J. Inhibition of DTYMK significantly restrains the growth of HCC and increases sensitivity to oxaliplatin. Cell Death Dis. 2021; 12:1093. Publisher Full Text | DOI | PubMed [ PMC Free Article ]
- Zhang L, Chen J, Cheng T, Yang H, Pan C, Li H. Identification of Differentially Expressed Genes and miRNAs Associated with Esophageal Squamous Cell Carcinoma by Integrated Analysis of Microarray Data. Biomed Res Int. 2020; 2020:1980921. Publisher Full Text | DOI | PubMed [ PMC Free Article ]
- Ramadan RA, Moghazy TF, Hafez R, Morsi H, Samir M, Shamesya M. Significance of expression of pyrimidine metabolizing genes in colon cancer. Arab J Gastroenterol. 2020; 21:189-93. DOI | PubMed
- Siddiqui A, Ceppi P. A non-proliferative role of pyrimidine metabolism in cancer. Mol Metab. 2020; 35:100962. Publisher Full Text | DOI | PubMed [ PMC Free Article ]
- Zhang L, Tao H, Li J, Zhang E, Liang H, Zhang B. Comprehensive analysis of the competing endogenous circRNA-lncRNA-miRNA-mRNA network and identification of a novel potential biomarker for hepatocellular carcinoma. Aging (Albany NY). 2021; 13:15990-6008. Publisher Full Text | DOI | PubMed [ PMC Free Article ]
- He G, Qiu J, Liu C, Tian B, Cai D, Liu S. MiR-148b-3p Regulates the Expression of DTYMK to Drive Hepatocellular Carcinoma Cell Proliferation and Metastasis. Front Oncol. 2021; 11:625566. Publisher Full Text | DOI | PubMed [ PMC Free Article ]
- Aloliqi AA, Fararjeh AF, Al-Khader A, Kaddumi E, Eisa AA, Jaradat W. The Impact of DTYMK as a Prognostic Marker in Colorectal Cancer. World J Oncol. 2023; 14:84-93. Publisher Full Text | DOI | PubMed [ PMC Free Article ]
- Zheng J, Wang Q, Yan L, Pan Q, Chen X, Chen Q. The Biological Behavior and Clinical Application Prospects of Deoxythymidine Kinase Gene in Tumors. Technol Cancer Res Treat. 2024; 23:15330338241265396. Publisher Full Text | DOI | PubMed [ PMC Free Article ]
- Sun Z, Zhang Z, Wang QQ, Liu JL. Combined Inactivation of CTPS1 and ATR Is Synthetically Lethal to MYC-Overexpressing Cancer Cells. Cancer Res. 2022; 82:1013-24. Publisher Full Text | DOI | PubMed [ PMC Free Article ]
- Ma S, Pu C. MiR-519e-5p regulates malignant phenotype of breast cancer cells through binding to CTPS1. Exp Cell Res. 2024; 442:114225. DOI | PubMed
- Asnagli H, Minet N, Pfeiffer C, Hoeben E, Lane R, Laughton D. CTP Synthase 1 Is a Novel Therapeutic Target in Lymphoma. Hemasphere. 2023; 7:e864. Publisher Full Text | DOI | PubMed [ PMC Free Article ]
- Shen G, He P, Mao Y, Li P, Luh F, Ding G. Overexpression of Uridine-Cytidine Kinase 2 Correlates with Breast Cancer Progression and Poor Prognosis. J Breast Cancer. 2017; 20:132-41. Publisher Full Text | DOI | PubMed [ PMC Free Article ]
- Huang S, Li J, Tam NL, Sun C, Hou Y, Hughes B. Uridine-cytidine kinase 2 upregulation predicts poor prognosis of hepatocellular carcinoma and is associated with cancer aggressiveness. Mol Carcinog. 2019; 58:603-15. DOI | PubMed
- El Hassouni B, Infante J, Mantini G, Ricci C, Funel N, Giovannetti E. Uridine Cytidine Kinase 2 as a Potential Biomarker for Treatment with RX-3117 in Pancreatic Cancer. Anticancer Res. 2019; 39:3609-14. DOI | PubMed
- Zhou L, Zhao C, Li J, Zhang D, Lu B, Chen Z. Relationship between up-regulation of DTYMK expression and immune infiltration for the prognosis of lung adenocarcinoma. J Clin Lab Anal. 2022; 36:e24234. DOI
- Zhou Q, Jiang H, Zhang J, Yu W, Zhou Z, Huang P. Uridine-cytidine kinase 2 promotes metastasis of hepatocellular carcinoma cells via the Stat3 pathway. Cancer Manag Res. 2018; 10:6339-55. Publisher Full Text | DOI | PubMed [ PMC Free Article ]


